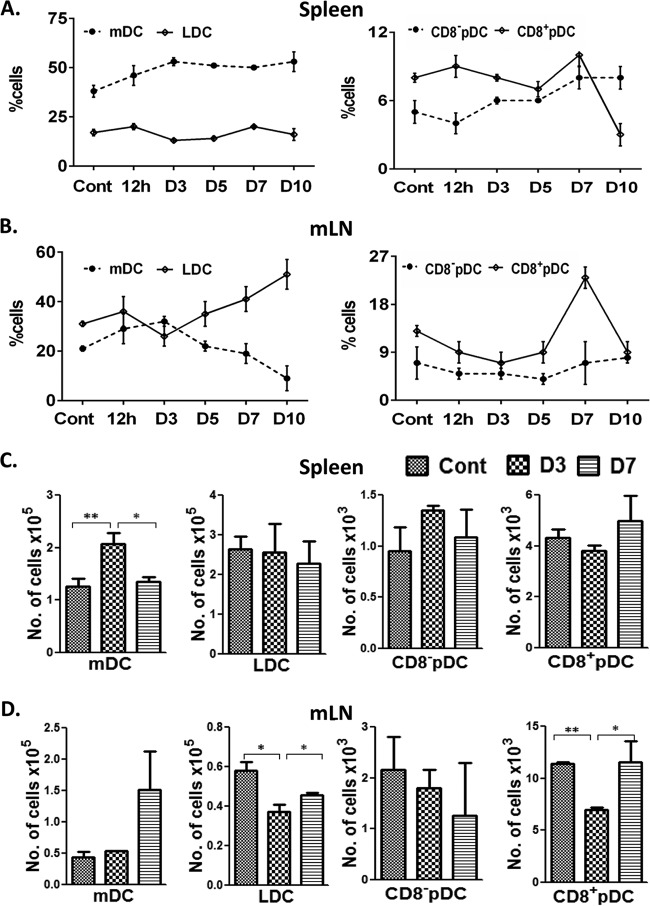
FIG 2.
Kinetics of host dendritic cell subset accumulation in the secondary lymphoid organs of mice. (A and B) Percentages of various host DC subsets as enumerated by flow cytometry in spleens (A) and mLNs (B) of mice at different time points post-Bm-L3 infection. (C and D) Absolute quantification of each DC subset, using TruCount beads, in spleens (C) and mLNs (D) of mice at day 3 and day 7 post-Bm-L3 infection. The data represent means ± SD of the results of three independent experiments with at least 5 or 6 animals/group. P values of ≤0.05 (*) and ≤0.01 (**) were considered significant and highly significant, respectively. Cont, control.

