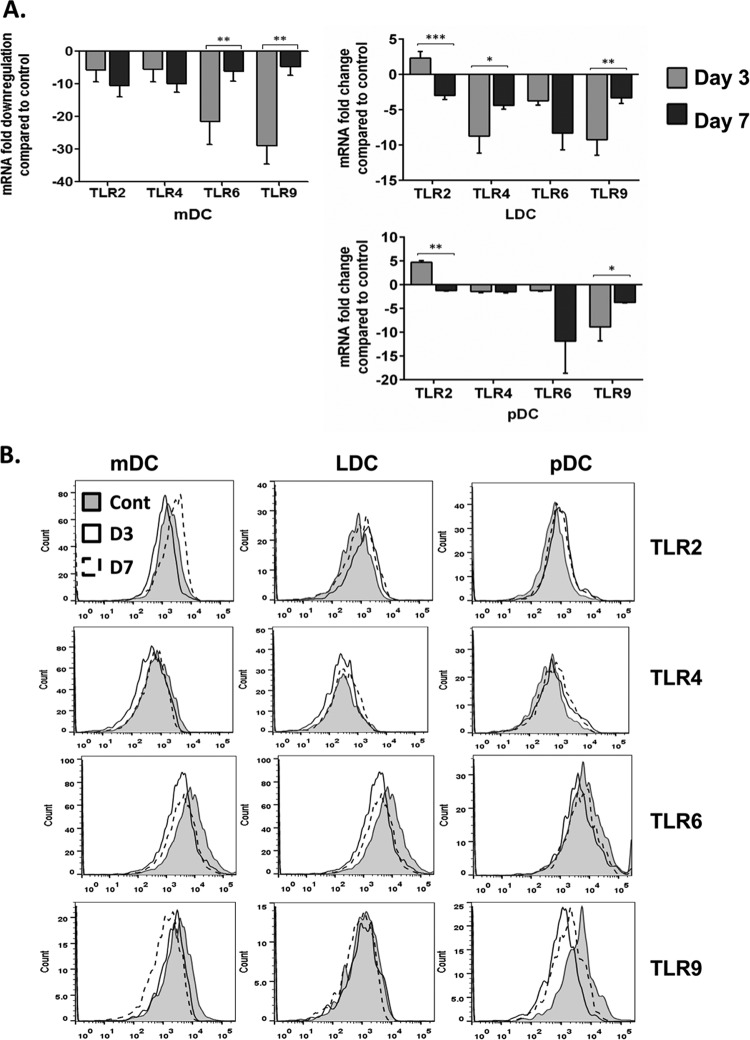
FIG 4.
Estimation of TLRs in host dendritic cell subsets. (A) Real-time RT-PCR was used to measure transcript levels of different TLRs in flow-sorted mDCs, LDCs, and pDCs at day 3 and day 7 post-Bm-L3 infection. The values represent fold changes (means ± SD) compared to an uninfected control. (B) Surface expression of TLR2, -4, and -6 and intracellular expression of TLR9 on each DC subset at day 3 and day 7 post-Bm-L3 infection, as assessed by flow cytometry. The data are representative of the results of three independent experiments with 5 or 6 mice/group. P values of ≤0.05 (*), ≤0.01 (**), and ≤0.001 (***) were considered significant, highly significant, and very highly significant, respectively.

