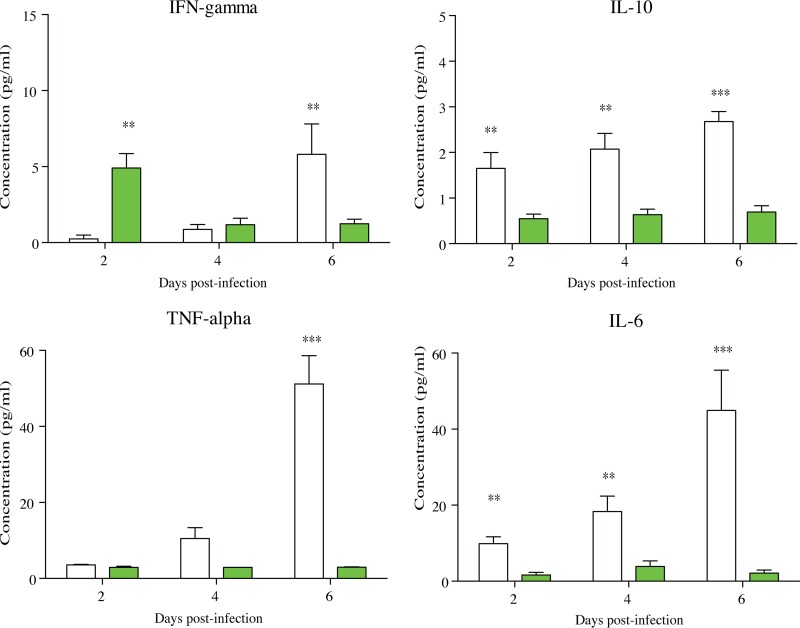
FIG 9.
Cytokine profiles in persistent-infection and controlled-infection granuloma-like structures over time. Mean rates of IFN-γ, IL-10, IL-6, and TNF-α were compared between persistent-infection (white bars) and controlled-infection (green bars) granuloma-like structures by two-way ANOVA (α = 0.05). *, P < 0.05; **, P < 0.001; ***, P < 0.0001.

