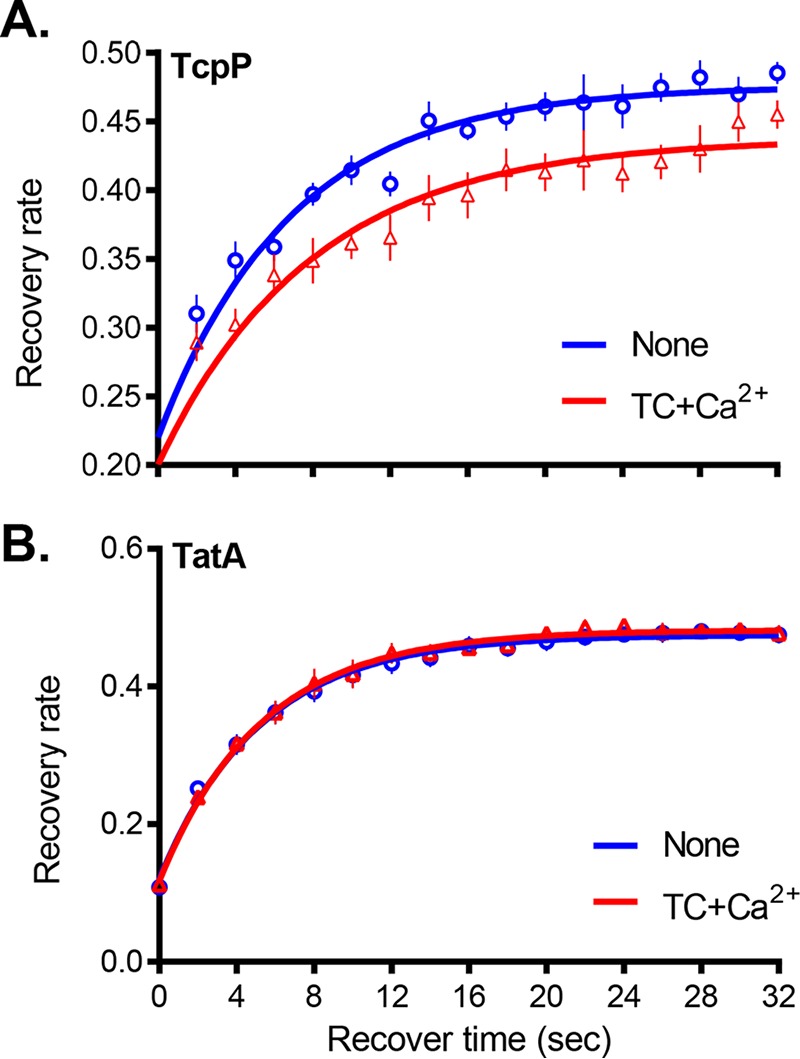
FIG 5.

Fluorescence recovery after photobleaching (FRAP) of fluorescently labeled membrane proteins. Cells were grown to mid-log phase in the presence of arabinose with 1 mM TC and 10 mM CaCl2 where indicated. After near-complete photobleaching with an argon laser, the fluorescence intensity was recorded within two equally sized circular regions, one in the middle of the bleached compartment A1(t) and the other in the middle of the unbleached compartment A2(t), for a given time. The fluorescence recovery data were normalized to the total remaining fluorescence. (A) GFP-TcpP recovery; (B) TatA recovery. The data shown are from three independent experiments and over 10 individual cells.
