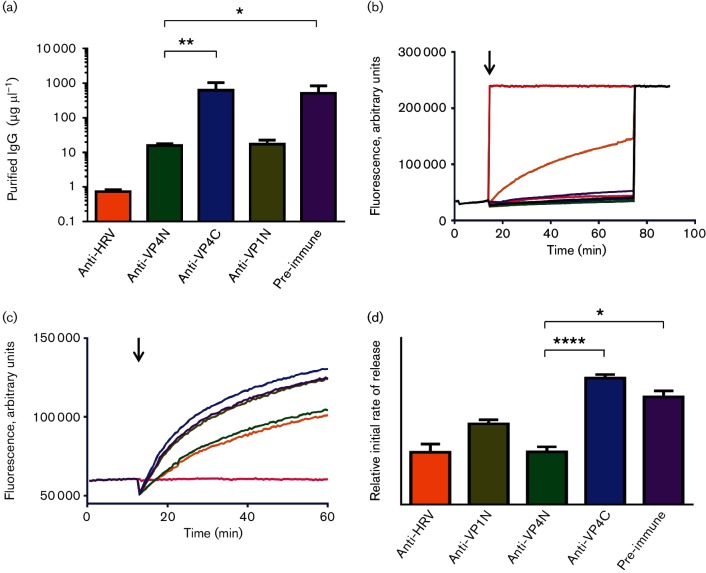
Fig. 1.
Antibodies raised against the N-terminus of VP4 neutralize HRV16 infectivity and reduce virus-induced permeability in model membranes. (a) Virus neutralization showing the minimum concentration of IgG (purified from antisera as indicated) required to neutralize 100 TCID50 of HRV16. Error bars represent standard error of the mean of values from four experiments. Asterisks indicate statistical significance calculated by one-way ANOVA (*P<0.05, **P<0.005). (b) Carboxyfluorescein (CF) release assays showing membrane permeability induced by 1 µg HRV16 (shown in orange) or 0.5 % Triton X-100 (shown in red). Membrane permeability induced by 1 µg pre-heated HRV16 (pink) or purified IgG from pre-immune sera (purple) or sera raised against the N-terminus of VP4 (green), C-terminus of VP4 (blue), N-terminus of VP1 (olive) or whole virus (grey) was close to baseline. At the end of the read, total release of CF was induced by the addition of 0.5 % Triton X-100 to all samples. The black arrow indicates time of addition of sample at the start of the assay. (c) CF release assays showing HRV16-induced membrane permeability after incubation of virus with purified IgG from pre-immune sera (shown in purple) or sera raised against the N-terminus of VP4 (anti-VP4N, shown in green), C-terminus of VP4 (anti-VP4C, shown in blue), N-terminus of VP1 (anti-VP1N, shown in olive green) or whole virus (anti-HRV, shown in orange). Baseline shown in pink. The black arrow indicates time of addition of sample at the start of the assay. (d) Initial rates of dye release generated using the first four data points from experiments as in (c). The colour scheme is the same as in (c). Error bars represent standard error of the mean of values from three independent experiments. Asterisks indicate statistical significance calculated by one-way ANOVA (*P<0.05, ****P<0.00005).

