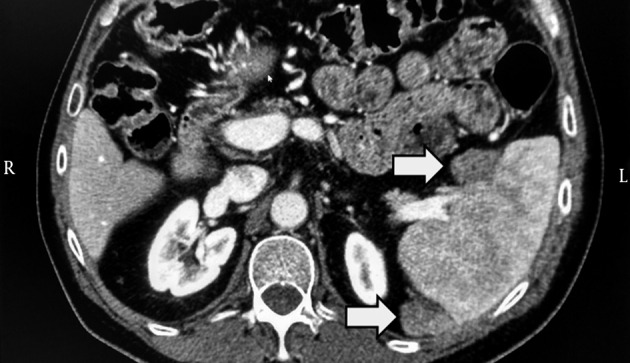
Figure 1. Contrast Enhanced Computed Tomography of Abdomen.

The image shows two solid-vascularized lesions of circa 2 × 2 cm at the splenic hilum and posterior extremity of the spleen. The two grey arrows indicate the two malignant lesions.

The image shows two solid-vascularized lesions of circa 2 × 2 cm at the splenic hilum and posterior extremity of the spleen. The two grey arrows indicate the two malignant lesions.