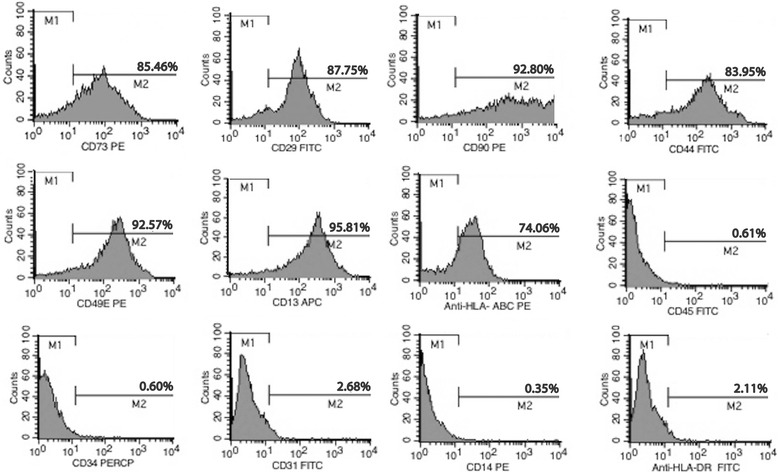
Fig. 1.

Characterization of pMSCs. Flow cytometry histograms show the expression levels of CD73, CD29, CD90, CD44, CD49e, CD13, HLA-ABC, CD45, CD34, CD31, CD14, and HLA-DR on pMSCs. Representative results from three independent experiments (biological replicates) are shown
