
Fig. 1.
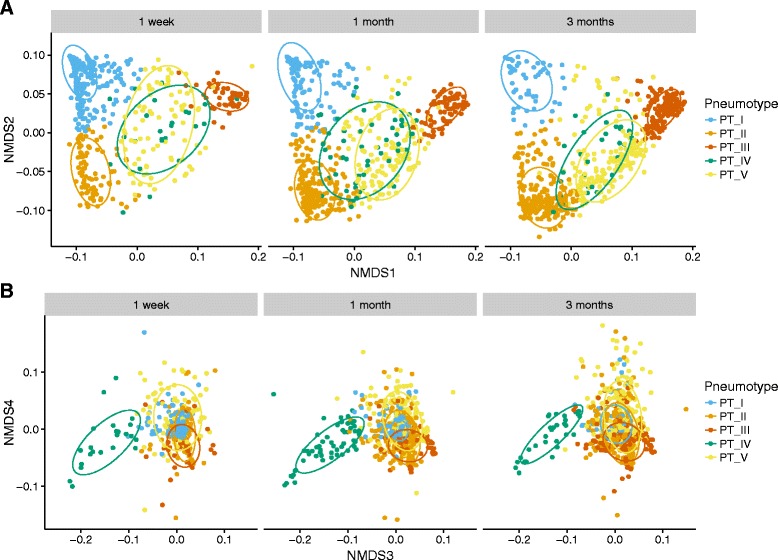
Pneumotype clusters separated in NMDS plots using 4 axes. Microbial clustering on the basis of weighted UniFrac distances, visualized by non-metric multidimensional scaling (NMDS, stress = 0.073), with ellipses encircling 75% of samples from each pneumotype. a Pneumotypes I, II, and III are separated on NMDS axes 1 and 2, with pneumotypes IV and V overlapping in the center of the plot. b On axes 3 and 4, pneumotype IV separates from the other pneumotypes. Axes’ minimum and maximum limits were fixed to exclude six outlying samples; the coordinates of these samples can be found in Additional file 1: Table S4