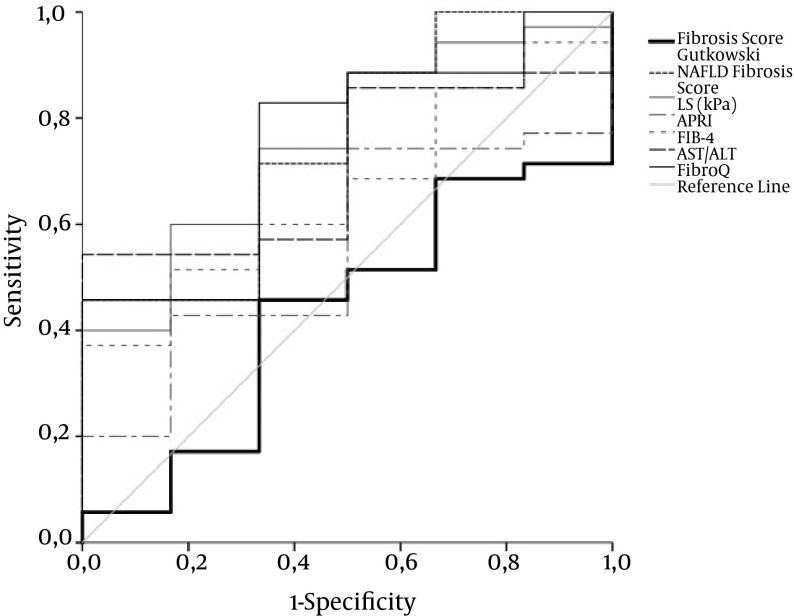
Figure 1. ROC Curve for LS, APRI, FIB-4, AST/ALT, FibroQ, NAFLD Fiibrosis Score, and Fiibrosis Score by Gutkowski for Fiibrosis Stage F1 Versus F2 - F4 in AIH Patients.
Only the ROC curve for TE exhibits acceptable overall performance to discriminate F1 from F2 - 4. Diagonal segments are produced by ties. Areas under the curve are presented in Table 2.

