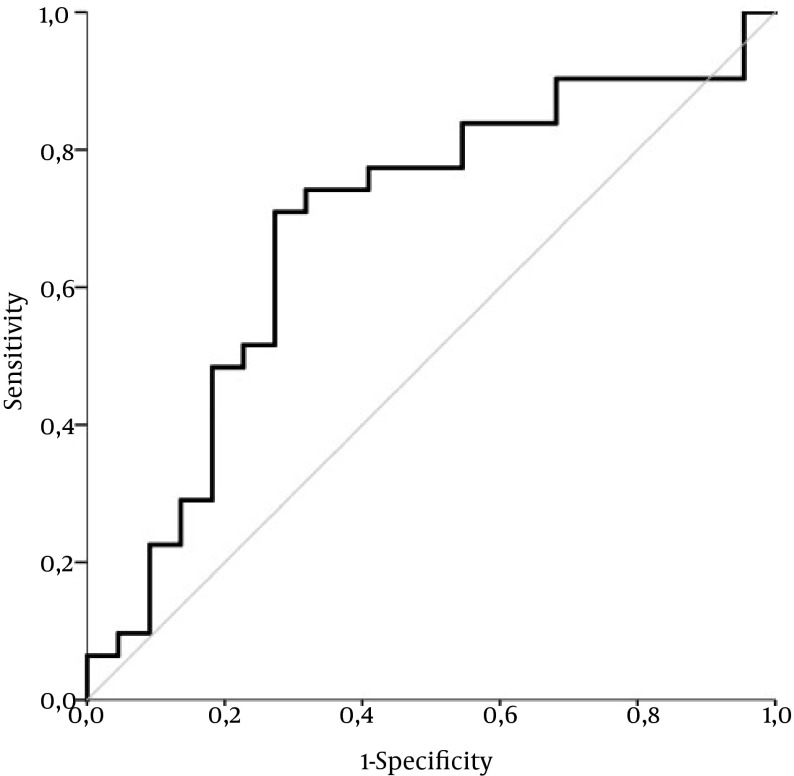
Figure 4. ROC Curve for Inflammatory Score by Gutkowski in Minimal and Mild (A1 - 2) Versus Moderate to Severe inflammation Grade (A3 - 4) in AIH Patients.
The ROC curve exhibited moderately acceptable performance with an area under the curve (AUC) of 0.688 ± 0.08 (P = 0.021) in differentiating minimal and mild (A1 - 2) from moderate to severe inflammation grade (A3 - 4). Diagonal segments are produced by ties.

