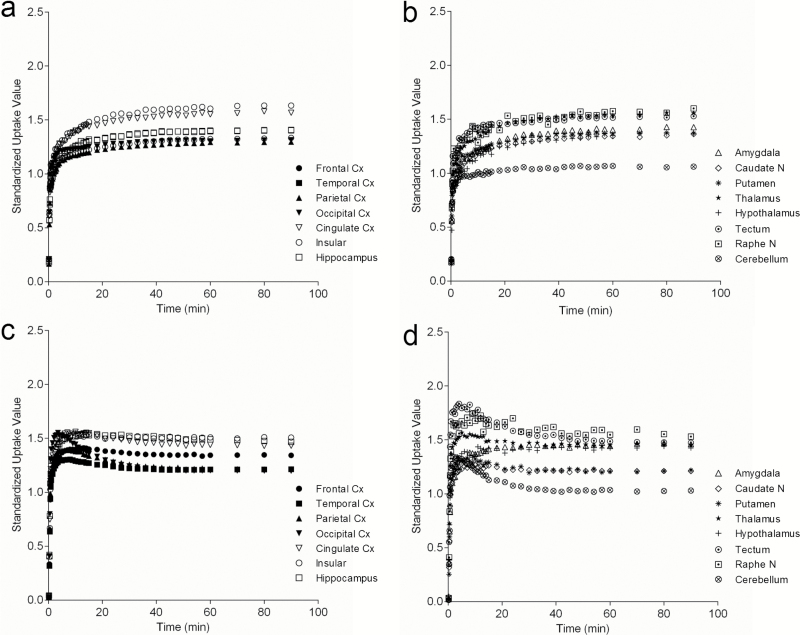
Figure 2.
Time activity curves of 18F-F13714 uptake in cortical (a and c) and subcortical (b and d) regions of interest in conscious (a-b) and isoflurane anesthetized (c-d) conditions. Anatomical locations of regions of interest refer to Figure 5. Data are mean values (n=4) to allow easy viewing, but relatively higher variability is found in each point of value in conscious (a-b) than in isoflurane anesthetized (c-d) conditions.

