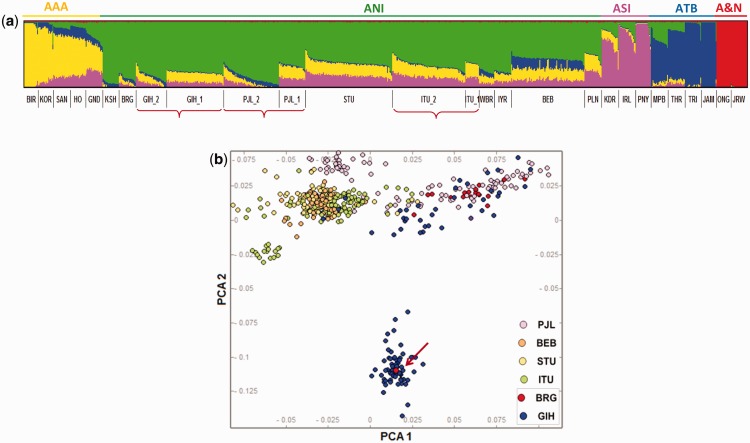
Fig. 3.—
Differences in the level of ancesty proportions in the three KGP IS population subgroups. (a) Admixture clustering analysis combining five KGP-IS populations and 20 Indian populations from the Basu study (Basu et al. 2016). At k= 5, the colour codes green, yellow, magenta, blue and red to represent the ANI, AAA, ASI, ATB and the Andamanese archepelago ancestries. (b) PCA showing five KGP Phase 3 Indian populations and an upper caste Gujrati Brahmin (BRG) from Basu study (Basu et al. 2016). The figure shows that one of the BRG individuals (shown by the arrow) clusters with the isolated GIH sub-group (GIH_1), whereas the other BRG individuals overlap with other north Indian populations (including the GIH_2 sub-group).

