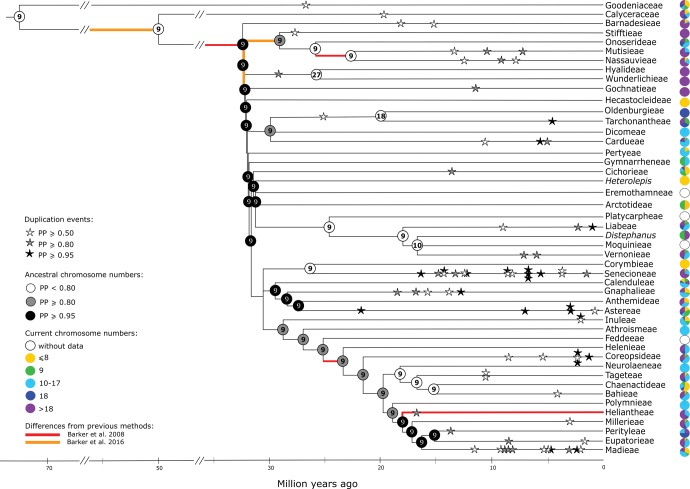
Fig. 1.—
Chromosome number evolution of the Asteraceae, using the polymorphic data and according to the best-fitted model obtained. The main tribes were collapsed. Stars represent the expected chromosome number duplication events, while the circles at the tips of each branch represent the percentage (%) of the current chromosome numbers known for each tribe. Inside each circle (at interior nodes) the ancestral chromosome number with the highest probability is given. The differences observed between our study and previous ones (Barker et al. 2008, 2016) are highlighted as red and orange branches, respectively. Overall, our approach did not infer any paleoploidization events near the base of the family, nor any paleoploidization shared with the sister family, Calyceraceae. Also, no paleoploidization event was detected near the base of the tribe Mutisieae. Colors and shading are explained in the inset. For further and more precise information about the percentage of the current chromosome numbers for each tribe, please see the supplementary table S3, Supplementary Material online.

