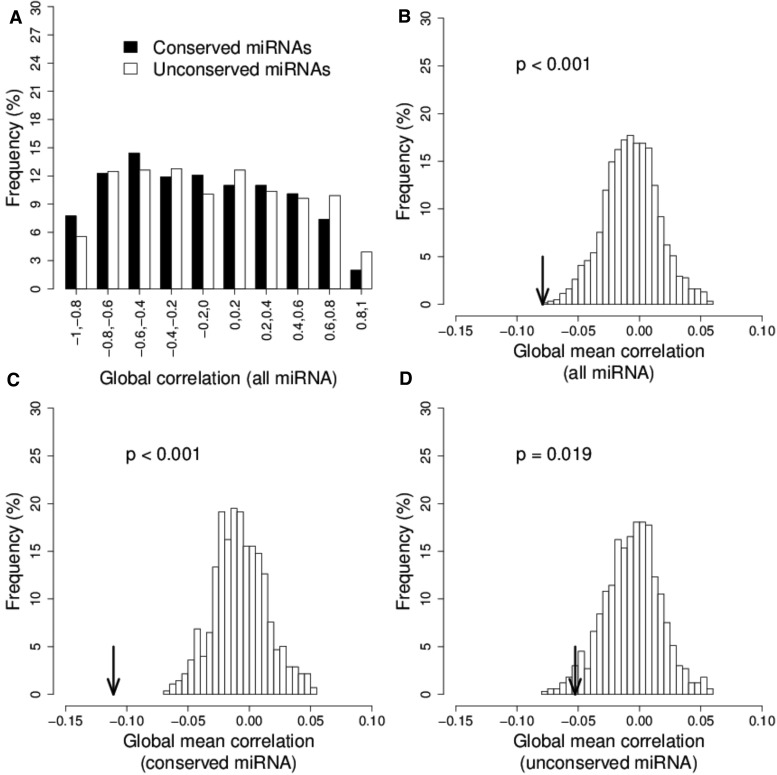
Fig. 5.—
Permutation of miRNA–mRNA target relationships at the lineage level. (A) The empirical distribution of the Pearson’s correlation coefficient values for 436 miRNA–mRNA pairs between expression levels of 96 miRNAs and those of their target mRNAs across 6 lineages. (B) The histogram plot represents the distribution of the global mean correlation values for the expression levels of all miRNA–mRNA pairs for 1,000 permutations, (C) for the highly conserved miRNAs and (D) for the lowly conserved miRNAs. The black arrowhead indicates the true value.

