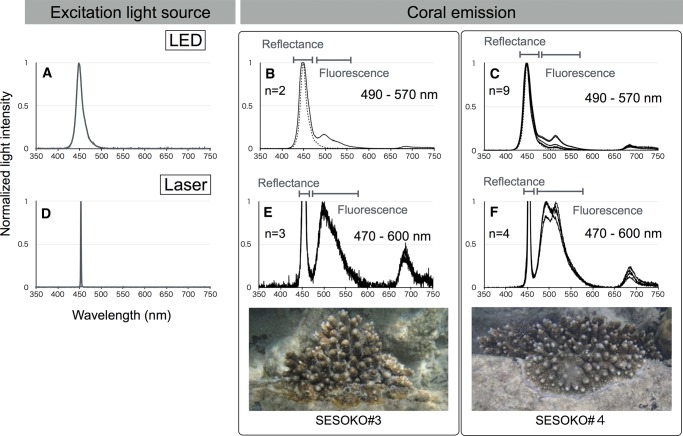
Fig. 1.—
Live coral fluorescence measurements in the field. Excitation spectra of different light sources, LED (A) and laser (D). Horizontal and vertical axes indicate wavelengths (nanometers) and normalized light intensities, respectively. A. digitifera emission spectra (solid line) excited by LED (B, C) and laser (E, F) lights from two colonies with different fluorescence emissions (SESOKO#3 and SESOKO#4). LED excitation spectrum is shown by a dotted line (B, C).

