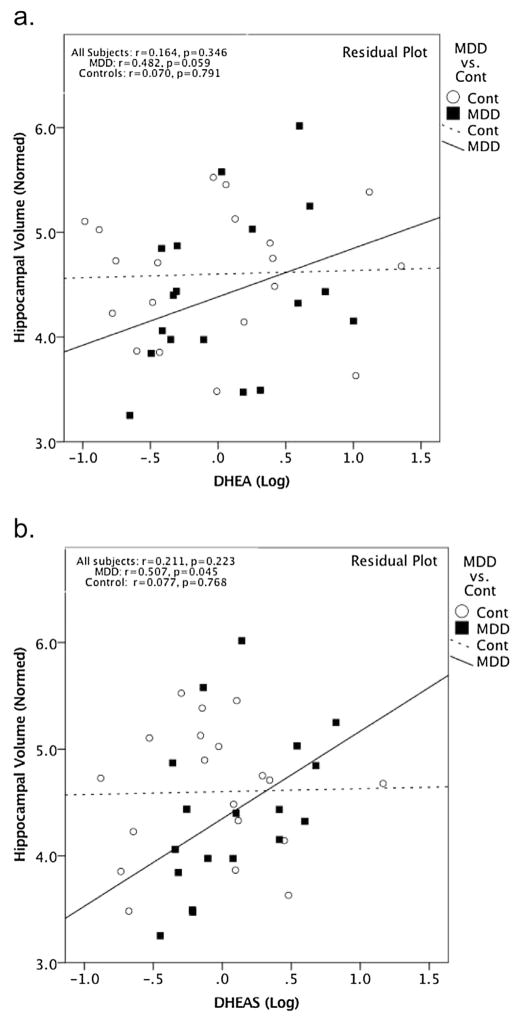
Fig. 3.
All plots are residual plots, covarying for age and sex. a. DHEA showed a positive trend with normed HCV within the MDD group (r = 0.482, p = 0.059, 95% CI [0.020, 0.774], df = 14) but not within the control group (r = 0.070, p = 0.791, 95% CI [−0.396, 0.508], df = 15) or across the overall group (r = 0.164, p = 0.346, 95% CI [−0.168, 0.463], df = 33). b. DHEAS was found to be positively correlated with HCV within the MDD group (r = 0.507, p = 0.045, 95% CI [0.053, 0.787], df = 14), but not within the control group (r = 0.077, p = 0.768, 95% CI [−0.39, 0.513], df = 15, respectively) or across the overall group (r = 0.211, p = 0.223, 95% CI [−0.121, 0.500], df = 33).

