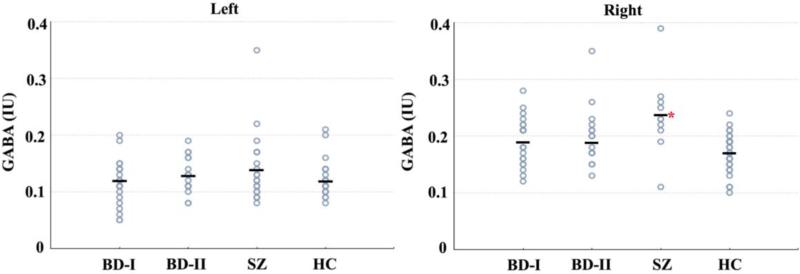
Figure 1.
GABA levels in groups. There was significant difference between groups at right hemisphere. Schizophrenia group had significantly higher GABA levels in comparison to healthy controls. There was no significant difference between groups at left hemisphere. BD-I: Bipolar I Disorder, BD-II: Bipolar II Disorder, SZ: Schizophrenia, HC: Healthy Controls. GABA levels are in international units (IU).

