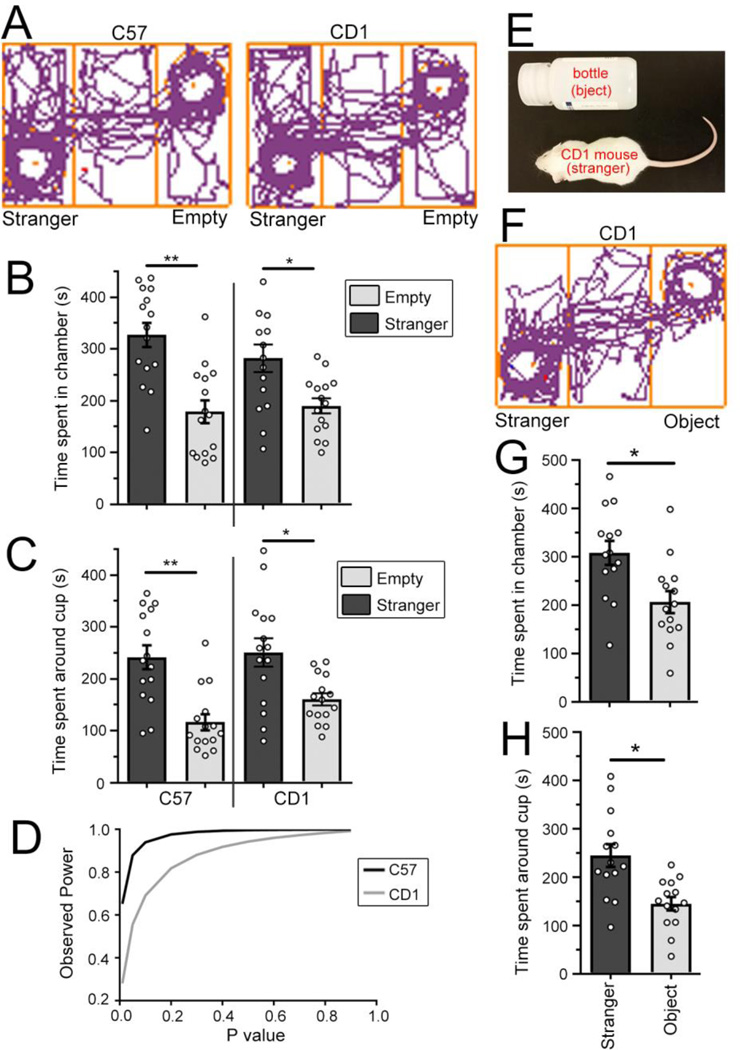
Figure 3. CD1 and C57 mice display similar sociability in the three-chamber social task following habituation in all three chambers.
(A) Track paths for CD1 and C57 mice using habituation version 2. (B and C) Bar graphs of the time spent in the chamber (B) or in close proximity of the cup (C) for C57 and CD1 mice using version 2 of the habituation protocol. **, P<0.01; *, P<0.05, two way ANOVA. (D) Graph of the observed power against the P value C57 and CD1 mice from data shown in B. (E) Photograph of a stanger mouse and the novel object used for the novelty test. (F) Track paths for CD1 mice using the three-chamber test with a novel object and a stanger CD1 mouse in the side chamber. (G and H) Bar graphs of the time spent in the chamber (G) or in close proximity of the cup (H) for CD1 mice. *, P<0.05, paired t-test. Bar: mean ± SEM.

