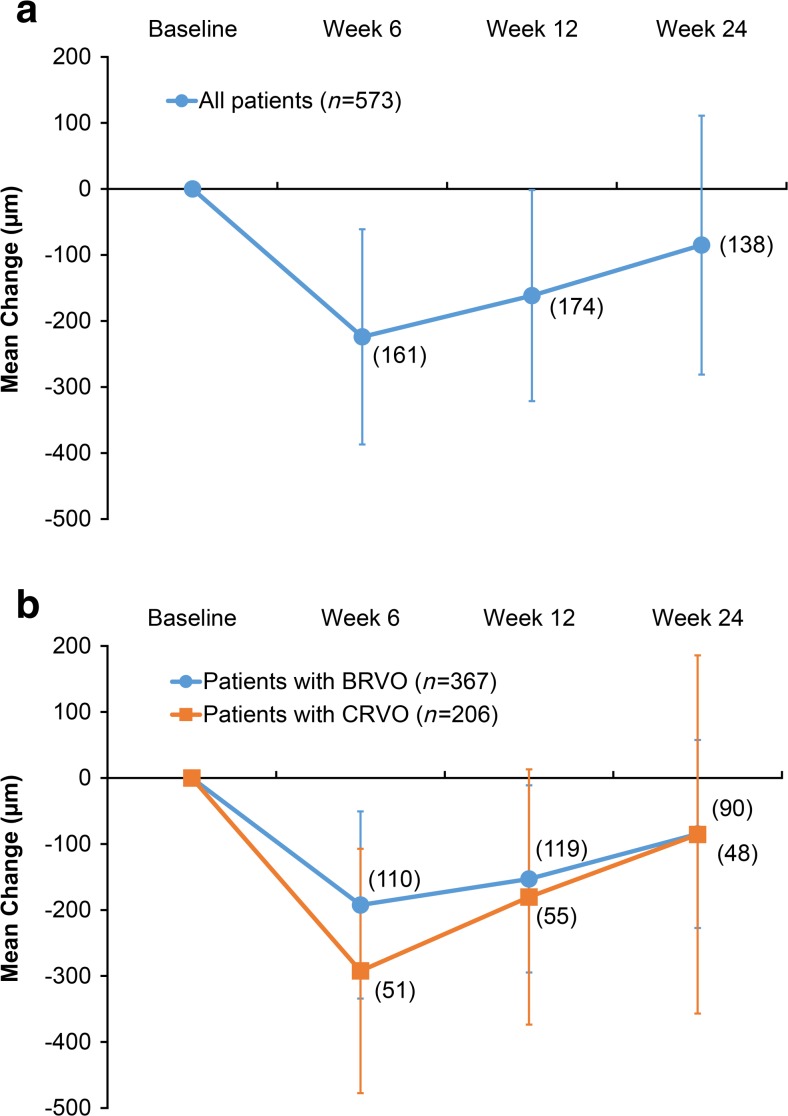
Fig. 3.
Mean change in central retinal thickness from baseline in (a) the total analysis population and (b) subgroups diagnosed with BRVO and CRVO. Error bars indicate standard deviation. Numbers in parentheses indicate number of patients (n). BRVO branch retinal vein occlusion, CRVO central retinal vein occlusion

