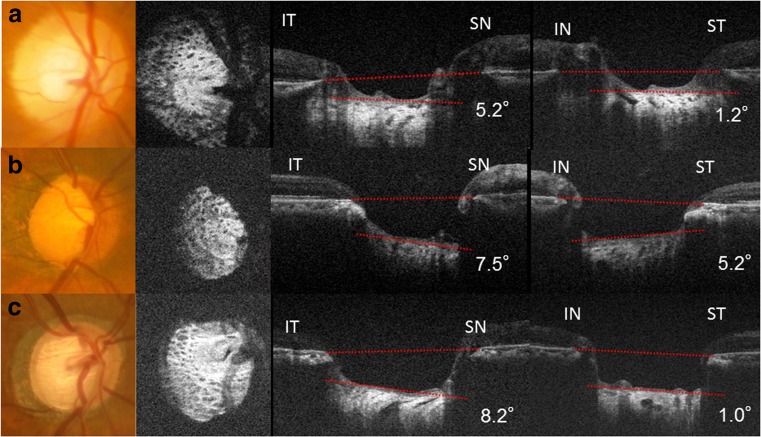
Fig. 2.
Fundus images and en face images from optical coherence tomography (OCT), and inferotemporal (IT) to superonasal (SN) direction and inferonasal (IN) to superotemporal (ST) direction B-scan images from optical coherence tomography (OCT). a (top) Images from the right eye of a 61-year-old male without glaucoma. The refractive error was +1.25D (top right). The LC tilting was mild in both the IT-SN direction (IT-LCTA) and the ST-IN direction (ST-LCTA). b (middle left) Images from the right eye of a 71-year-old male with glaucoma. The refractive errors were −6.00D and the visual field mean deviation was −15.22 decibels. Both IT-LCTA (middle center) and ST-LCTA (middle right) were evident. c (bottom left) Images from the right eye of a 73-year-old male with glaucoma. The refractive errors were −1.00D, and the visual field mean deviation was −15.52 decibels. IT-LCTA was greater than ST-LCTA. IT-SN (bottom center) and ST-IN (bottom right) views of the B-scan image

