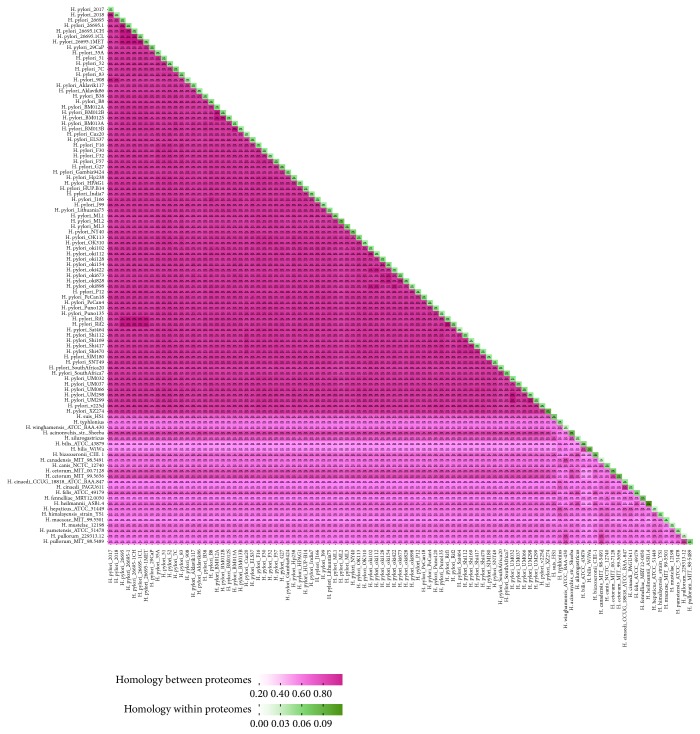
Figure 2.
Homologous proteins analysis among proteomes (orthologous) and internal proteomes (paralogous) in the Helicobacter genus species. The blocks on the diagonal represent paralogous data and the others represent orthologous data. The percentage of orthologous and paralogous proteins are represented by red and green, respectively. The similarity is indicated by depth of color. The number of homologs and percentage of similarities between/within proteomes are shown in corresponding block.

