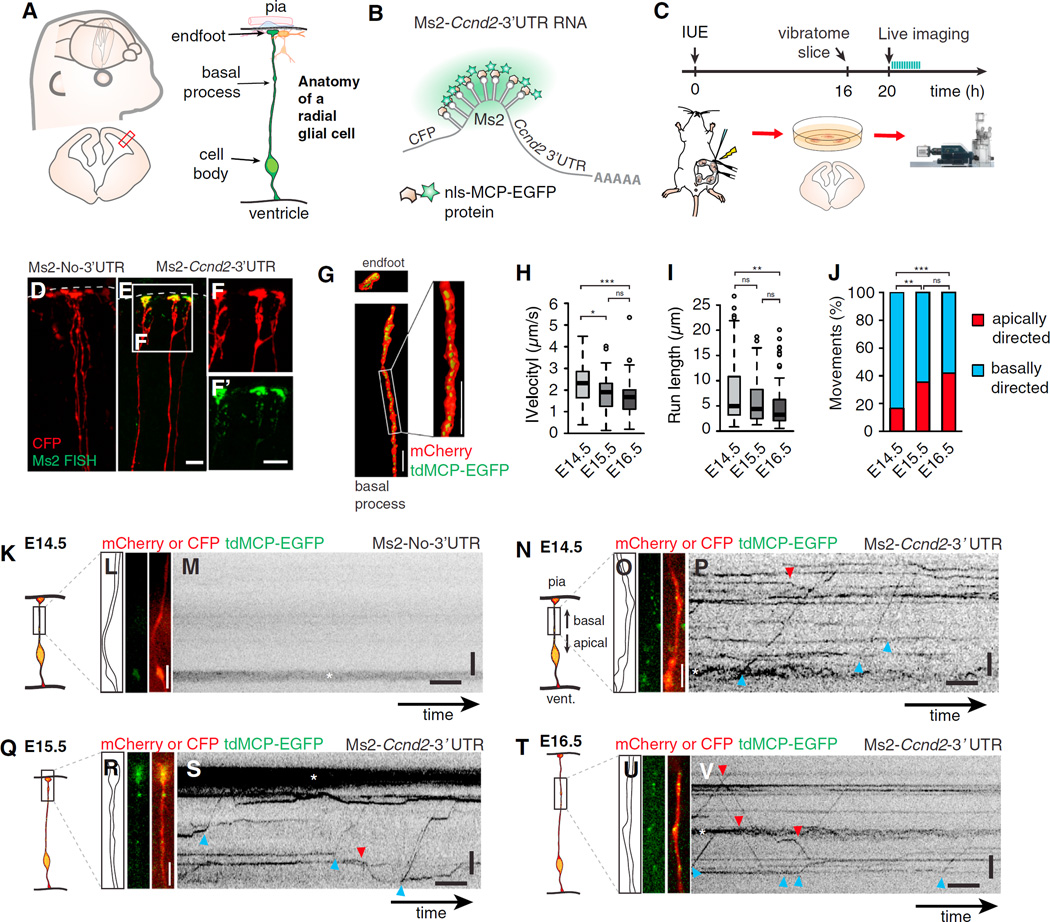
Figure 1. Live Imaging of Embryonic Organotypic Brain Slices Shows Directed mRNA Movement in Radial Glia Basal Processes.
(A) Cartoon representations show embryonic neocortex, coronal section (left), and radial glial cell (RGC) with the indicated features.
(B) Approach used for imaging mRNA, in which mCherry or CFP is followed by a 3′ UTR with binding sites for the MCP-EGFP protein, as shown.
(C) Timeline and overview of the live-imaging experiment (IUE, in utero electroporation).
(D–F) Confocal images show smFISH against Ms2 (green; D, E, and F’) in Ms2-No-3′ UTR (D) and Ms2-Ccnd2–3′ UTR (E and F) electroporated RGCs (red).
(G) 3D reconstructions show an RGC endfoot and basal process (red) electroporated with mCherry-Ms2-Ccnd2–3′ UTR and tdMCP-EGFP (green).
(H and I) Boxplots showing velocities (H) and run lengths (I) at the indicated ages. Velocity was calculated from kymographs and absolute value of average velocities for apical and basal movements.
(J) Graph depicts apically (red) and basally (blue) directed movements at the indicated ages. E14.5, n = 153 movements, n = 28 cells, three experiments; E15.5, n = 98 movements, n = 18 cells, three experiments; E16.5, n = 100 movements, n = 62 cells, three experiments.
(K–V) Examples of live imaging of mRNAs in RGCs of brain slices from E14.5 (K–P), E15.5 (Q–S), and E16.5 (T–V). Shown are schematic representations of the regions imaged (K, N, Q, and T), outlines and still images acquired prior to live imaging (L, O, R, and U), and kymographs of Ms2-Ccnd2–3′ UTR (P, S, and V) or negative control (no 3′ UTR) (M). RNAs were actively moving apically (red arrowhead) or basally (blue arrowhead) and were evident within varicosities (*).
Scale bars, 10 (D–F) and 4 µm, (L, M, O, P, R, S, U, and V) y axis, length, 5 µm; x axis, time, 5 s. Boxplots represent median; bottoms and tops of boxes represent 25th and 75th percentiles, and whiskers represent median ± 1.5 × interquartile range. *p < 0.05, **p < 0.01, and ***p < 0.001. See also Figure S1 and Movie S1.

