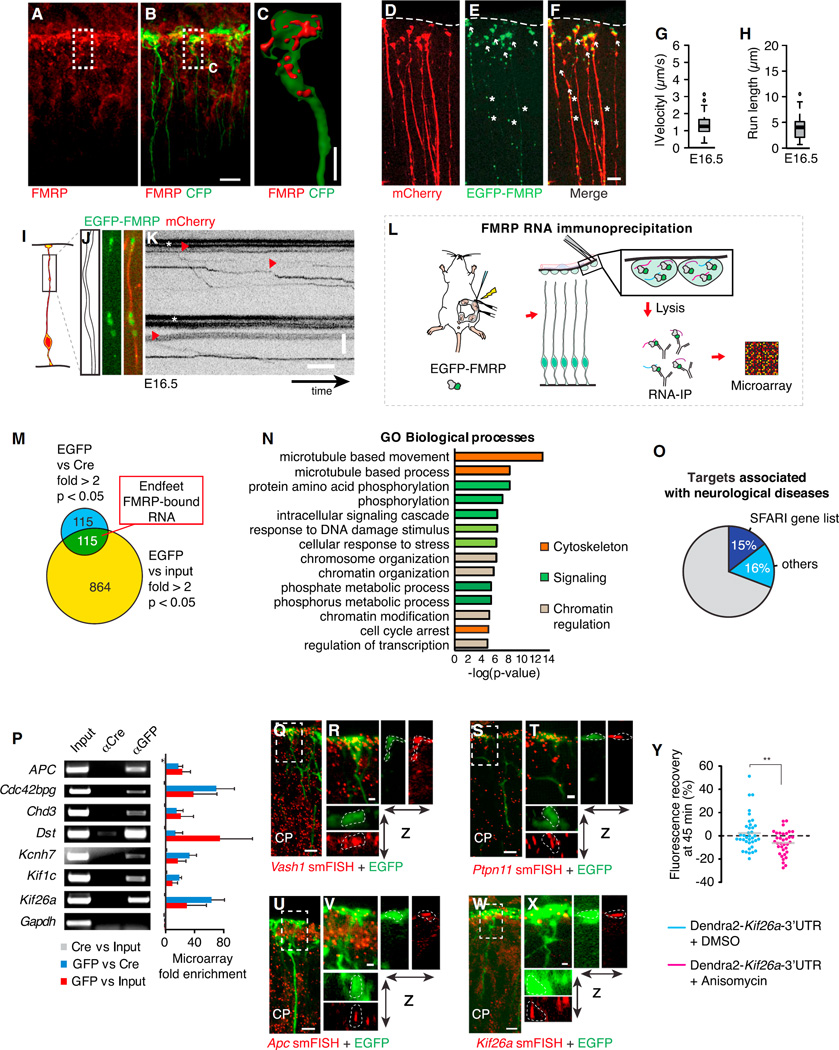
Figure 3. The RNA-Binding Protein FMRP Actively Moves in Radial Glia to Basal Endfeet, Where It Is Bound to a Local Transcriptome.
(A–C) Localization of FMRP protein (red) in E16.5 CFP+ RGC endfeet (A and B), with 3D reconstruction of endfoot (C), as shown.
(D–F) Electroporated mCherry (D; cytoplasmic filler), EGFP-FMRP (E) localization in basal processes (asterisks) and endfeet (arrows), and overlay of mCherry and EGFP-FMRP signal (F).
(G–K) Live imaging shows EGFP-FMRP in E16.5 RGCs in brain slices, with boxplots showing velocity (G) and run length (H) quantification (n = 57 granules, 155 cells, two experiments), schematic representation of the region imaged (I), outline and still images (J), and kymographs (K).
(L) Schematic overview shows RNA immunoprecipitation-microarray (RIP-chip) experiment.
(M) Venn diagram represents criteria for identifying endfeet FMRP-bound RNAs.
(N) Gene ontology (GO) analyses of FMRP-bound RNAs in RGC endfeet.
(O) Graph depicts the fraction of FMRP endfoot target genes associated with neurological disorders, including those genes identified in the SFARI database as autism associated.
(P) The RT-PCR validation of select identified RIP-chip transcripts showing input, and immunoprecipitation by Cre and GFP. Gapdh is a negative control.
(Q–X) The smFISH (red) validation of Vash1 (Q and R), Ptpn11 (S and T), Apc (U and V), and Kif26a (W and X) in EGFP+ RGCs (green) in E16.5 cortices (CP, cortical plate). (R, T, V, and X) Close-up views show regions highlighted in (Q), (S), (U), and (W) with x-z and y-z projections.
(Y) Green fluorescence recovery at 45 min plotted for individual endfeet (circles), showing translation (>0) or no translation (<0) of an exogenous Dendra2-Kif26a-3′ UTR mRNA ± Anisomycin treatment (40 µM, 20 min) (n = 10–15 endfeet/replicate, n = 3 replicates each). Boxplots represent median; bottoms and tops of boxes represent 25th and 75th percentiles, and whiskers represent median ± 1.5 × interquartile range. **p < 0.01.
Scale bars, 10 (A, B, D–F, Q, S, U, and W), 1.25 (R, T, V, and X), and 2.5 µm (C). (J and K) y axis, 5 µm; x axis, 5 s. Error bars, SD. See also Figure S3, Movies S2 and S3, and Table S1.

