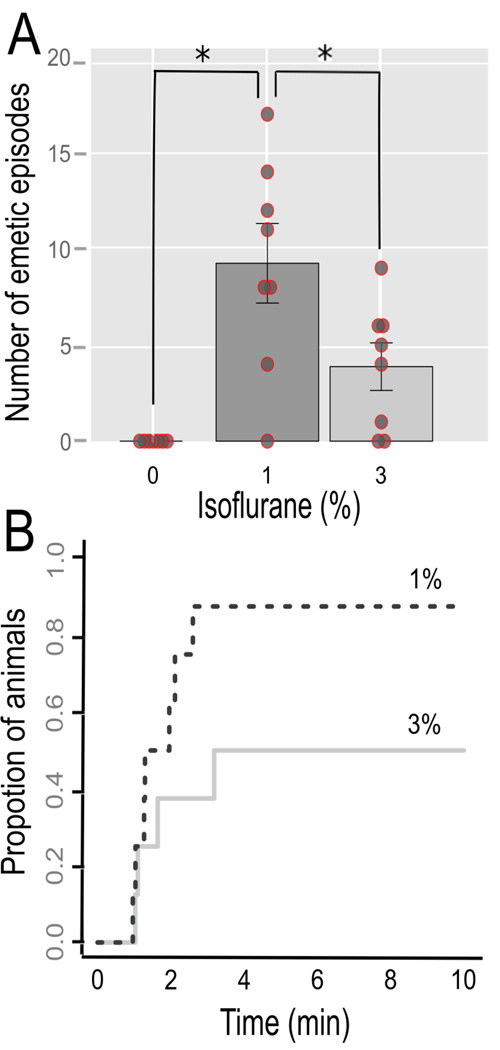
Fig. 3.
Study 2: Isoflurane-induced emesis. (A) Total number of emetic episodes in each condition (0, 1, and 3% isoflurane exposure. Values represent the mean ± SEM. * = Tukey’s test, p < 0.05. A scatter plot of raw data is also shown. (B) Cumulative proportion of animals showing the latency to the first emetic episode in the 1 and 3% isoflurance conditions.

