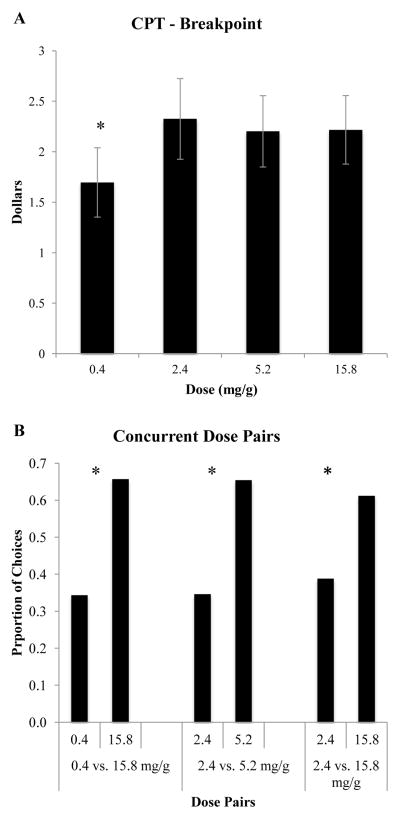
Figure 2.
Panel A: Mean Breakpoint from the Cigarette Purchase Task across experimental cigarettes differing in nicotine content (mg/g). Panel B: Mean proportion of choices allocated to different nicotine dose cigarettes during separate 3-hour two-dose concurrent choice sessions. All possible two-dose comparisons across the four nicotine dose cigarettes (0.4, 2.4, 5.2, and 15.8 mg/g tobacco) were examined; only those that differed significantly are shown. The two-dose comparisons are shown on the x-axis with mean proportion of choices allocated to each shown on the y-axis. Asterisks in Panels A and B indicate significant dose differences at p < .05.

