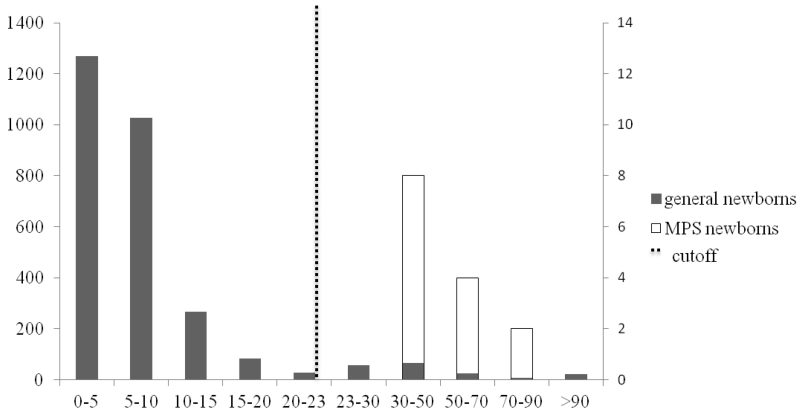
Figure 2.
HS-NS in general newborns and MPS newborns
Primary left y-axis represents solid bars for the number of general newborns (n=2862) among the different intervals; secondary right y-axis represents open bars for the number of MPS newborns (n=14) among the different intervals; dashed line represents the cutoff (median + 7× MAD for control newborns).

