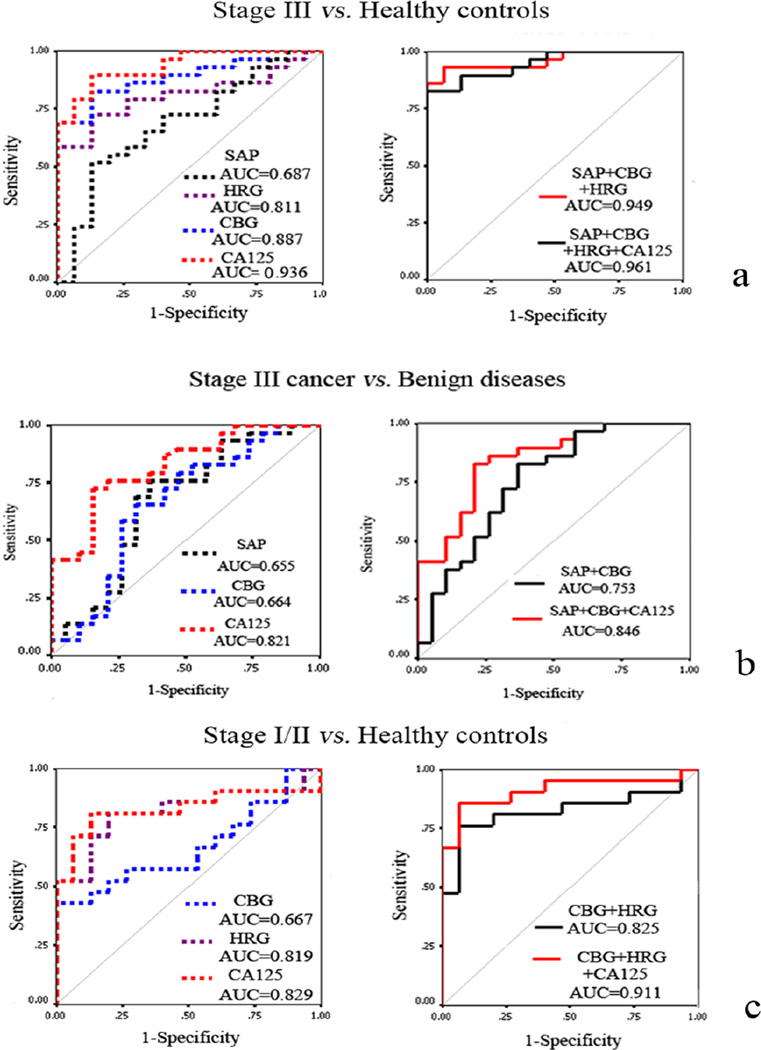
Figure 1.
ROC curve analyses of significantly changed proteins detected by ELISA. (a) ROC curve for differentiating stage III ovarian cancer from normal healthy controls; (b) ROC curve for differentiating stage III ovarian cancer from benign diseases; (c) ROC curve for distinguishing stage I/II ovarian cancer from normal healthy controls. Reprinted from ref. 59. Copyright © 2012, American Chemical Society.

