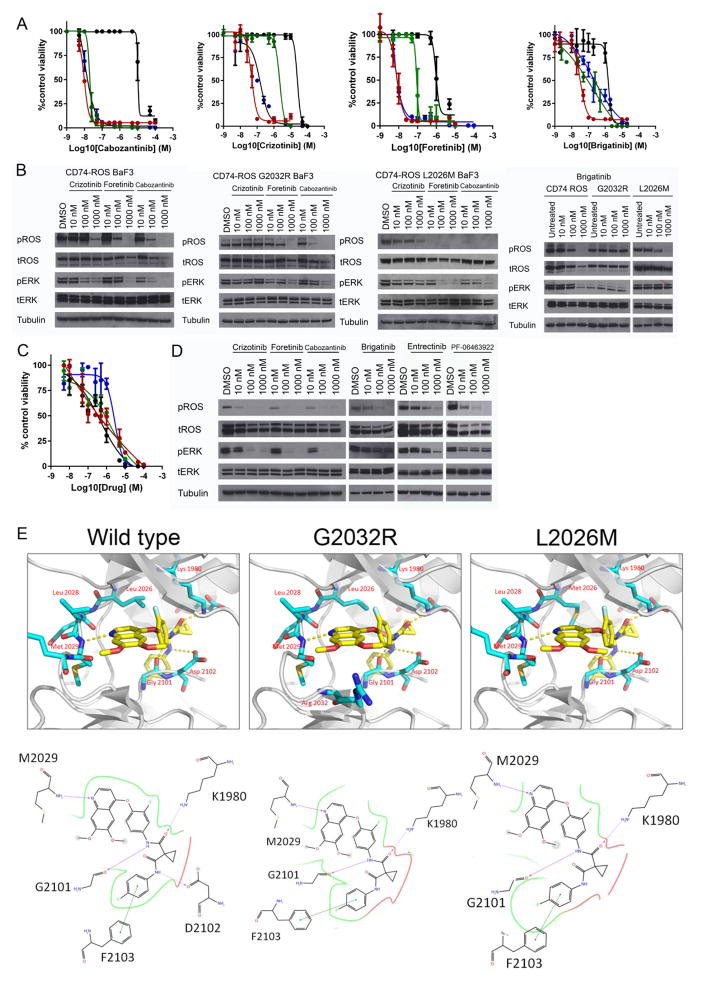
Figure 3.
A: Inhibition of Ba/F3 transformed with CD74-ROS1 wildtype (red,
 ), G2032R (green,
 ), L2026M (blue,
 ), and Ba/F3 parental cells (black, ●). B: Effect of drugs on ROS1 autophosphorylation (pY2274) and downstream activation of ERK signaling. C: Inhibition of the HCC78 NSCLC cell line by brigatinib (blue,
 , IC50 = 2.2 μM), cabozantinib (red,
 , IC50 = 1.36 μM) crizotinib (green,
 , IC50 = 1.6 μM), and foretinib (black, ●, IC50 = 0.46 μM); data for alectinib (IC50 = 0.75 μM), brigatinib (IC50 = 2.2 μM), ceritinib (IC50 = 0.53 μM), entrectinib (IC50 = 0.45 μM), and PF-06463922 (IC50 = > 10 μM) not shown. D: Inhibition of ROS signaling in HCC78 cells. E: Molecular modeling of cabozantinib into the active site of ROS1 kinase domain, with dashed lines indicating hydrogen bonds.

