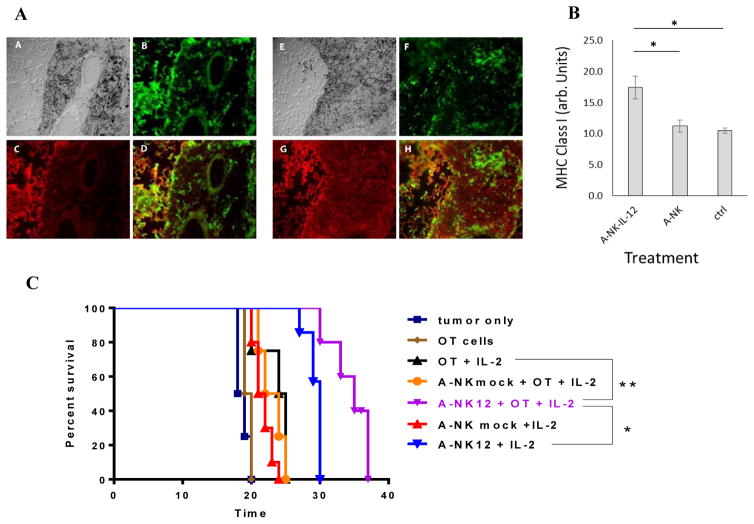
Figure 7. Anti-tumor effect of combined treatment with IL-12 gene-transduced A-NK cells and tumor specific CTLs.
Tumor-homing by A-NK and IL-12-gene-transduced A-NK cells (A-NKIL-12) and changes in tumor MHC class-I expression was measured in mice with 0VA-B16 lung tumors. Tissue-sections were stained with FITC-anti-Thy1.1 to reveal the transferred A-NK cells and with PE-anti-H-2Kb to reveal MHC expression in the tissues. The expression of MHC was measured by image analysis of tissue-sections. A: A+E: DIC images of B16-M05 tumors from mice treated with A-NK cells (A) and A-NKIL-12 cells (E), respectively. B+F: FITC-Thy1.1 positive A-NK (B) and A-NKIL-12 (F) cells, respectively. C+G: PE-H-2Kb weakly and strongly positive tumors from mice treated with A-NK (C) and A-NKIL-12 (G) cells. D+H: Overlay of B and C (D) and F and G (H). B: Expression of H-2Kb (arbitrary units) in tumors from animals receiving IL-12 gene-transduced A-NK cells (A-NKIL-12), mock-transduced A-NK cells (A-NK), and no cells (ctrl). *: p<0.01. C: Mice bearing 7 days old B16-OVA lung tumors were injected i.v. with A-NK cells (4 × 10⁶), OT-I cells (3 × 10⁶), or both (n=4–6 animals per group). All mice (except those receiving neither A-NK, nor OT-I cells (“tumor only”) or only OT-I cells (“OT cells”) received one i.p. injection of 30,000 IU Peg-IL-2 immediately after the cell injection. Kaplan-Meyer survival curves were constructed. A-NK12 + OT + IL-2 vs. tumor only: +16.5 days (p<0.005); vs. A-NK12+IL-2: + 5 days (p<0.01); vs. A-NKmock + OT-I + IL-2: +12 days (p<0.005); vs. OT-I + IL-2: +11days (p=0.005); vs. OT-1: +15.5 days (p=0.005). *: p<0.01; **: p<0.005.

