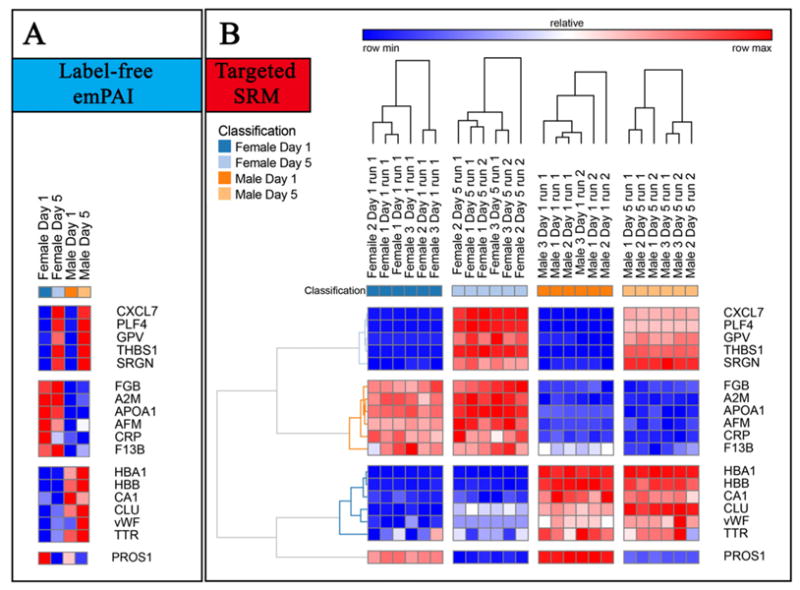
Fig. 6.

In A, a detail of a subset of proteins from apheresis platelet supernatants showing significant quantitative variations with respect to storage duration (top and bottom clusters), gender (second and third cluster from the top), as determined through label-free mass spectrometry-based approaches. In B, heat maps represent quantitative fluctuations of the very same proteins, as determined through targeted approaches based upon LC-SRM against labeled QConCAT standards.
