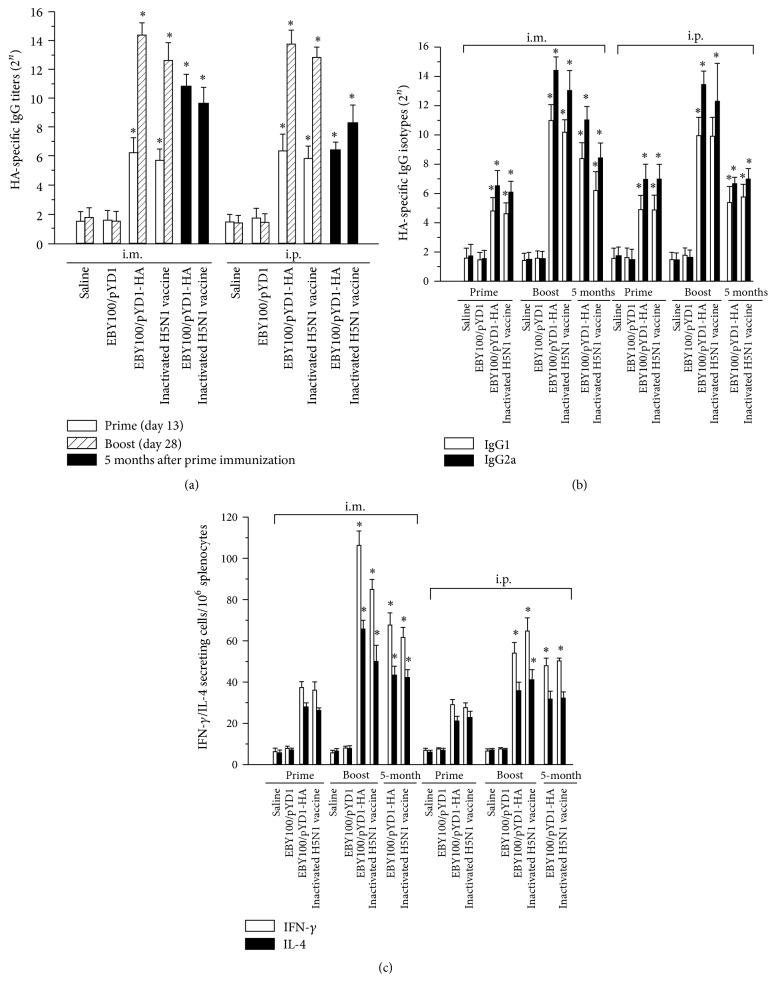
Figure 4.
Detection of humoral and cellular immune response elicited by HA surface-displayed vaccines in immunized mice. Sera were collected from vaccinated mice and tested for production of (a) HA-specific IgG antibodies at day 13 (n = 21 mice/group), day 28 (n = 21 mice/group), and 5 months (n = 5 mice/group) after prime immunization and (b) IgG isotypes. (c) The numbers of IFN-γ/IL-4 secreting T cells in vaccinated mice. Splenocytes were isolated from vaccinated mice at day 10 (n = 3 mice/group) and day 24 (n = 3 mice/group) after the prime immunization and evaluated by ELISpot. Data are represented as mean ± SD. Asterisk indicates significant difference, as compared to the controls (PBS and EBY100/pYD1 injected mice) (∗ p < 0.05).

