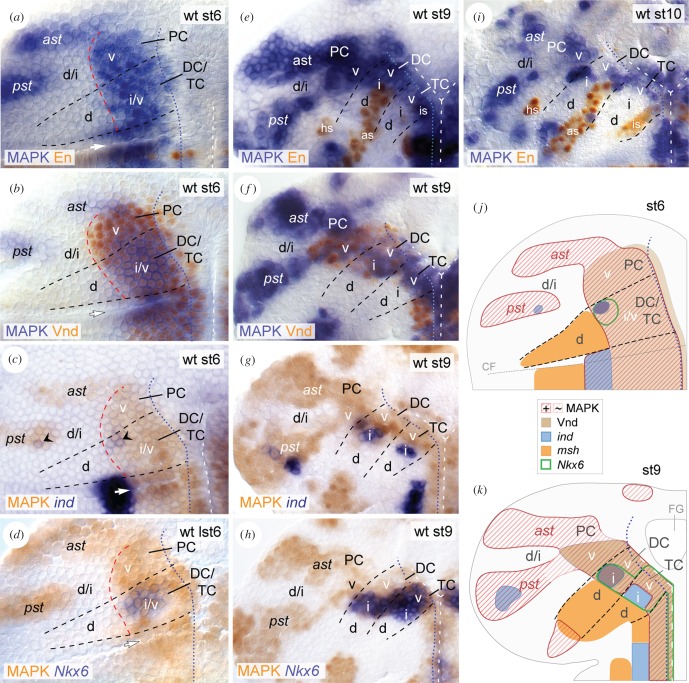
Figure 1.
MAPK pattern in the brain NE. (a–i) Flat preparations displaying the wild-type (wt) head ectoderm of the left hemisphere at stage 6 (st6) (a–d), stage 9 (st9) (e–h), and stage 10 (st10) (i); anterior is up. MAPK pattern is combined with En (a,e,i), Vnd (b,f), ind (c,g) and Nkx6 (d,h). (c,g) ind expression in DC/PC (black arrowheads in (c)), but not in TC (g) initiates within MAPK-positive NE. (j,k) Schematic representation of gene expression patterns in (a–i) (also including msh expression; see also electronic supplementary material, figure S1). ast, anterior and pst, posterior protocerebral MAPK stripe. v, ventral; i, intermediate; d, dorsal. Dashed lines in black indicate borders between trito- (TC), deuto- (DC), protocerebrum (PC). At stage 6 (which is slightly prior to the expression of the segmental marker En in the brain NE), tentative boundaries between presumptive brain neuromeres were estimated with regard to the distance from the cephalic furrow (CF; white arrow in (a–d)) in AP axis and the AP extent of DV gene expression domains (i.e. ind in (c) and Nkx6 in (d); see also [52,53]). Dashed lines in white indicate the ventral midline. Dashed lines in red (in (a–d)) mark the border between intermediate/dorsal NE in TC/DC, and ventral/intermediate NE in PC. Dotted lines in blue indicate border between NE and mesectoderm. FG, foregut; hs, en head spot; as, en antennal stripe; is, en intercalary stripe. See the main text for further details.

