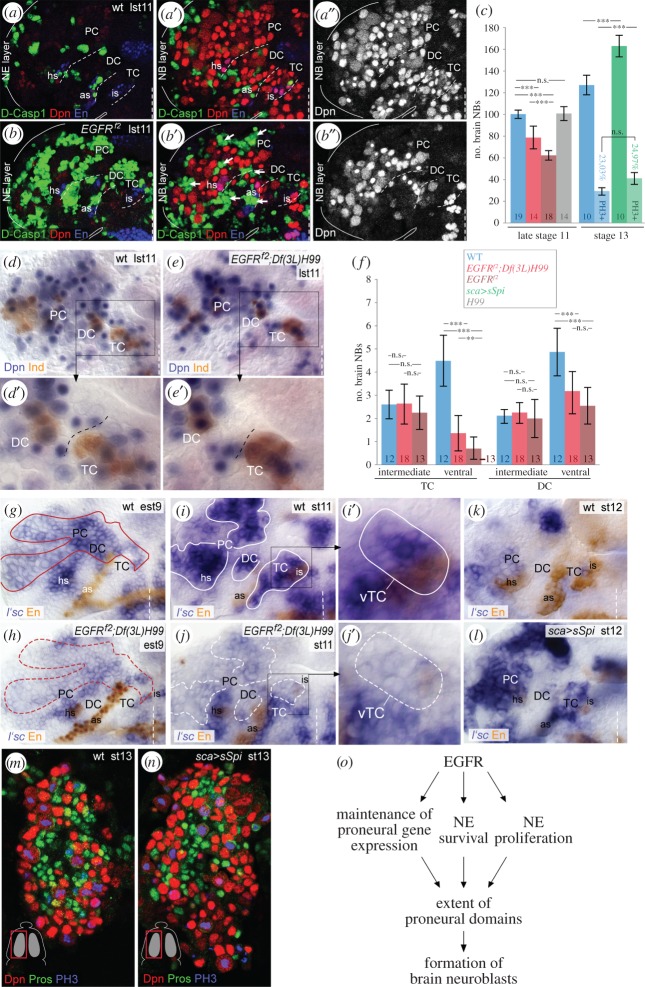
Figure 6.
EGFR signalling is crucial for brain neuroblast formation. (a,a′,a″,b,b′,b″) Flat preparations of wild-type (a,a′,a″) and EGFRf2 mutants (b,b′,b″) at late stage 11 (lst11). The wild-typic and mutant NE (a,b) or neuroblast (NB) (a′,a″,b′,b″) layer depicted in these panels each represent a combined projection of an equal amount of confocal foci (in Z-axis). Dcp1-signal is broadly detected in the brain NE (a,b) of EGFRf2 mutants, but not in underlying neuroblasts (a′,a″,b′,b″). The brain neuroblast number is strongly reduced in the EGFRf2-mutant hemisphere, in which totally 56 neuroblasts were counted (in b′,b″), when compared with 104 neuroblasts in the wild-type hemisphere (in a′,a″). Note that at late stage 11 almost the entire NE undergoes cell death in EGFRf2 mutants. As the neuroectodermal layer dissolves, apoptotic neuroectodermal cells come to lie within the neuroblast layer (white arrows). (c) Quantification of the number of brain neuroblasts in different genotypes. Number of neuroblasts per hemisphere at stage 11: wt 100.3 ± 4.1; EGFRf2 62.3 ± 4.7; EGFRf2;Df(3L)H99 78.8 ± 10.8; H99 100.8 ± 6.7; at stage 13: wt 127.2 ± 9.2 (of those 29.0 ± 3.5 neuroblasts [23.0%] are PH3-labelled); sca > spi 163.4 ± 11.0 (of those 40.8 ± 5.5 neuroblasts [25.0%] are PH3-labelled); numbers within bars indicate n; error bars indicate s.d.; ***p < 0.0001, n.s., not significant; unpaired Student's t-test). (d,e) At late stage 11, the number of Dpn-positive brain neuroblast is significantly reduced in EGFRf2;Df(3L)H99 mutants. (d′,e′) Higher magnification of areas boxed in (d,e). The number of ventral (black asterisks) but not of (Ind-positive) intermediate neuroblasts (white asterisks) is reduced in TC/DC of those mutants. (f) Quantification of the number of intermediate/ventral neuroblasts in TC/DC (at stage 11) in different genotypes. Number of neuroblasts/hemisphere at stage 11: intermediate neuroblasts in TC: wt 2.6 ± 0.6; EGFRf2;H99 2.6 ± 0.9; EGFRf2 2.2 ± 0.7; intermediate neuroblasts in DC: wt 2.1 ± 0.3; EGFRf2;H99 2.3 ± 0.5; EGFRf2 2.0 ± 0.8; ventral neuroblasts in TC: wt 4.5 ± 1.1; EGFRf2;H99 1.4 ± 0.8; EGFRf2 0.7 ± 0.5; ventral neuroblasts in DC: wt 4.9 ± 1.0; EGFRf2;H99 3.2 ± 0.9; EGFRf2 2.6 ± 0.8); numbers within bars indicate n; error bars indicate s.d.; **p < 0.01, ***p < 0.0001, n.s., not significant; unpaired Student's t-test). (g,h) Wild-typic MAPK domain is outlined in red in (g), and for comparison in the EGFRf2;H99 mutant (h). l'sc expression is reduced in PC, DC and ventral TC particularly in the EGFRf2-mutant domain (indicated in (h)) at early stage 9 (est9). (i,i′,j,j′) Loss of L'sc expression at stage 11 (white hatched outlines in (i)), when compared with wild-type (white solid outline in (j)). (i′,j′) Higher magnification of NE in ventral TC discloses loss of l'sc expression, corresponding to the loss of ventral neuroblasts (see (e′)). (k,l) l'sc expression is widely downregulated after formation of brain neuroblast at stage 12 in wild-type (k), but maintained upon sca > sSpi (l). (m,n) Dorsal view on left hemisphere. Number of Dpn-positive/Pros-negative (Pros indicates ganglion mother cells) brain neuroblasts is increased by stage 13 in sca > sSpi embryos (n), when compared with wild-type (m); the mitotic index of neuroblasts (as judged by PH3-labelling) is unaltered (see (c)). (o) EGFR controls formation of brain neuroblast in multiple ways (see the main text). For orientation, other abbreviations and symbols see figure 1.

