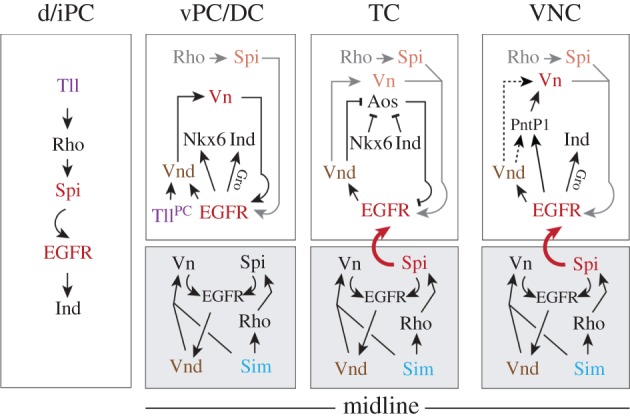
Figure 7.

A model of genetic interactions between EGFR and other factors that pattern the brain in the DV axis, when compared with the VNC. Separated boxes show proposed genetic interactions in the NE (white boxes) of dorsal/intermediate (d/i) PC (left), ventral PC/DC (middle left), TC (middle right), VNC (right) and the ventrally adjacent mesectoderm (or midline; grey boxes), as deduced from the data in this study. In TC/DC, genetic factors/ligands active during the early period of EGFR signalling are indicated in grey/orange, respectively. Bent arrows indicate activity of secreted factors. Genetic control of EGFR is different in TC, DC and PC. For example, EGFR activity becomes midline-dependent only in TC (indicated by bent arrow in red), similar to the situation in the VNC. In the VNC, genetic interactions for PntP1 refer to [42]; it is unknown if EGFR signal induces vn expression via Vnd and PntP1 (indicated by stippled arrows). The potential role of PntP1 in the brain is unclear. See the main text for further details.
