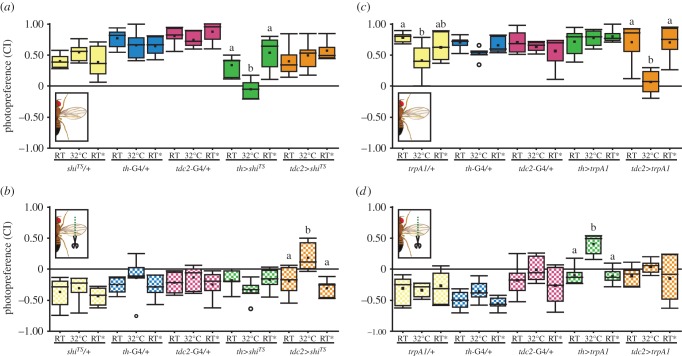
Figure 7.
DA and OA are necessary and sufficient to modulate phototactic behaviour, but with opposite effects. (a,b) Photopreference from flies with (a) and without (b) wings before, during and after DA or OA/TA neuron silencing. (a) Randomized block design ANOVA, block p = 0.026, interaction genotype versus temperature p < 0.001, simple effects with Tukey's post hoc test (p < 0.05, least-significant difference = 0.24, tdc2>shits least-significant difference = 0.263): shits/+ p = 0.208, th-GAL4/+ p = 0.417, tdc2-GAL4/+ p = 0.428, th>shits p < 0.001, tdc2>shits p = 0.242. n = 6 except for tdc2>shits RT* (n = 5). (b) Randomized block design ANOVA, block p = 0.006, interaction genotype versus temperature p = 0.02, simple effects with Tukey's post hoc test (p < 0.05, least-significant difference = 0.278, tdc2>shits least-significant difference = 0.288): shits/+ p = 0.533, th-GAL4/+ p = 0.394, tdc2-GAL4/+ p = 0.6, th>shits p = 0.262, tdc2>shits p < 0.001. n = 6 except for tdc2>shits RT* (n = 5). (c,d) Photopreference from flies with (c) and without (d) wings before, during and after DA or OA neuron activation. (c) The Kruskal–Wallis test for temperature factor comparison within genotypes (alpha after correction = 0.013): trpA1/+ p = 0.012, th-GAL4/+ p = 0.069, tdc2-GAL4/+ p = 0.667, th>trpA1 p = 0.97, tdc2>trpA1 p = 0.004. th-GAL4/+ and th>trpA1, n = 6; trpA1/+, tdc2-GAL4/+ tdc2>trpA1, n = 7. (d) The Kruskal–Wallis test for temperature factor comparison within genotypes (alpha after correction = 0.013): trpA1/+ p = 0.834, th-GAL4/+ p = 0.15, tdc2-GAL4/+ p = 0.126, th>trpA1 p = 0.005, tdc2>trpA1 p = 0.415. th-GAL4/+ and th>trpA1, n = 6; trpA1/+, tdc2-GAL4/+, tdc2>trpA1, n = 7. Different letters indicate significant differences between temperatures for each genotype (only shown for genotypes where the factor temperature had a statistically significant effect). See figure 2 for detailed graph information.

