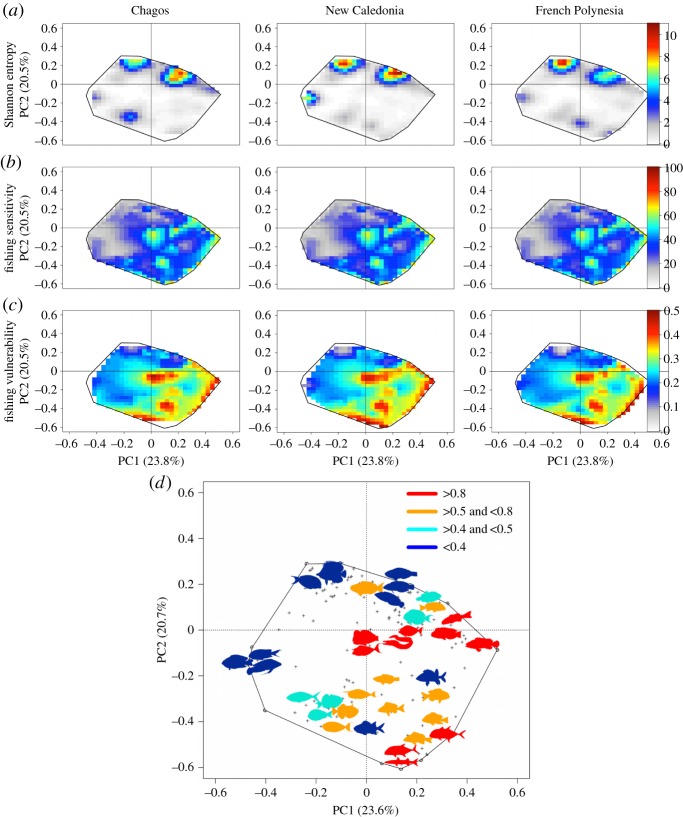
Figure 4.
Mapping redundancy, sensitivity and vulnerability in the functional space for fish faunas of the three regions. The top row (a) shows for each region the distribution of functional redundancy within functional entities, measured using the Shannon entropy, across the functional space. The middle row (b) shows the distribution of sensitivity to fishing across the functional space while the bottom row (c) shows the distribution of vulnerability to fishing in this space, and (d) position of vulnerable functional entities in the functional space. Colours indicate the level of vulnerability of functional entities and fish shapes were chosen to illustrate the main genus of each functional entity (see also the electronic supplementary material, figure S6).

