Figure 4.
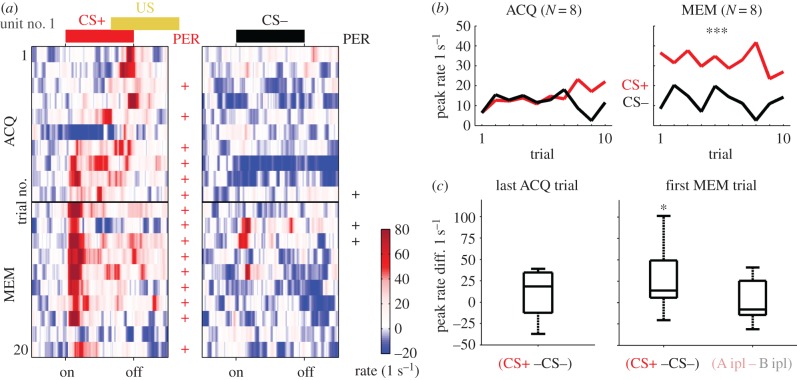
Neural response evolution during acquisition and memory retention trials. (a) Single trial response rates of one unit showing the highest factor loading (figure 3c) for all conditioning (ACQ) and memory retention (MEM) trials starting from top. CS+ stimulations are shown on the left, CS− stimulations on the right. Coloured bars on top indicate stimulus onset and duration. During ACQ the reward was presented (US, yellow). The black horizontal line indicates the 3 h pause between ACQ and MEM. A behavioural response (PER) of this bee is indicated by a plus symbol next to the respective trial. (b) Trial-resolved average peak rate (y-axis) across the extracted units. During ACQ there was no differentiation between CS+ (red) and CS− (black) (Wilcoxon's rank sum test, p = 0.43). During the MEM phase the neural responses differed significantly, separating the CS+ from the CS− (Wilcoxon's rank sum test, p = 0.0002). (c) Distribution across the differences between CS+ and CS− peak rate in the final ACQ trial and in the first MEM trial. Only the latter difference was significant, indicating stronger MBON responses to the CS+ than to the CS− (signed-rank test: first MEM trial, p < 0.05; last ACQ trial, p = 0.28). The same odours presented to the ipsilateral side did not show a significant difference (A ipl–B ipl; signed-rank test, p = 0.97).

