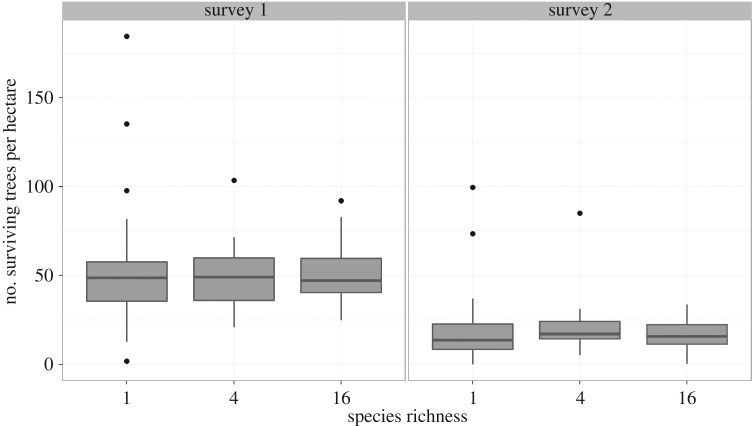
Figure 3.
Density of surviving first-cohort seedlings as a function of plot species richness. The number of seedlings per ha within each plot, summarized with box and whiskers: boxes show the 25th, 50th and 75th percentile density, and whiskers extend to the most extreme density values within 1.5 times the interquartile range. While the median density remains constant, variation among plots decreases as species richness increases, particularly after two years (survey 1).

