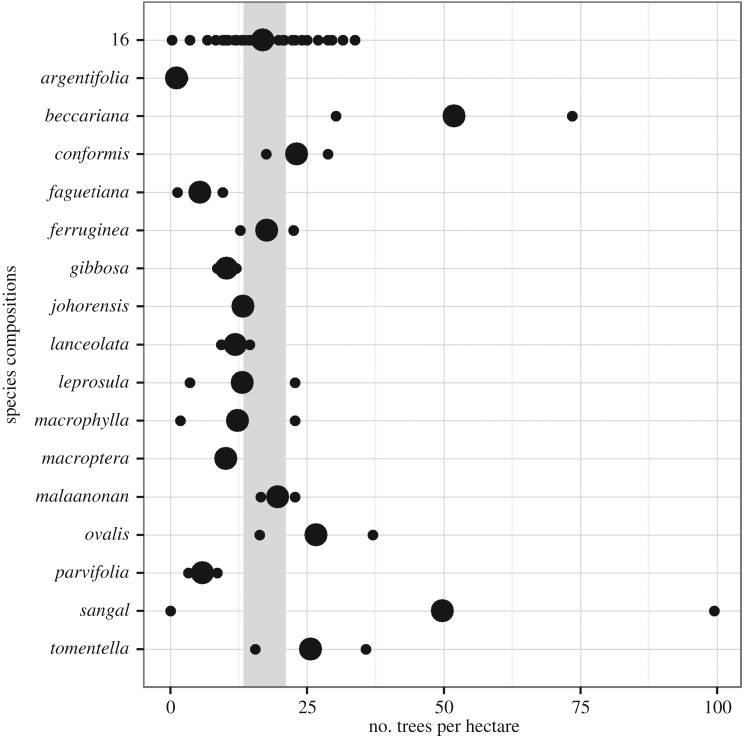
Figure 4.
Density of surviving first-cohort seedlings after 10 years, in 16-species mixtures and monocultures. Small points show densities in each plot and large points the average. The grey band shows the 95% confidence interval of the 16-species mixture mean. The confidence interval for the probability of survival, p, was obtained using the Wilson method [48], then expressed as the number of surviving trees per ha, (p·n)/4. Many monocultures show extreme average densities compared with the 16-species mixture.

