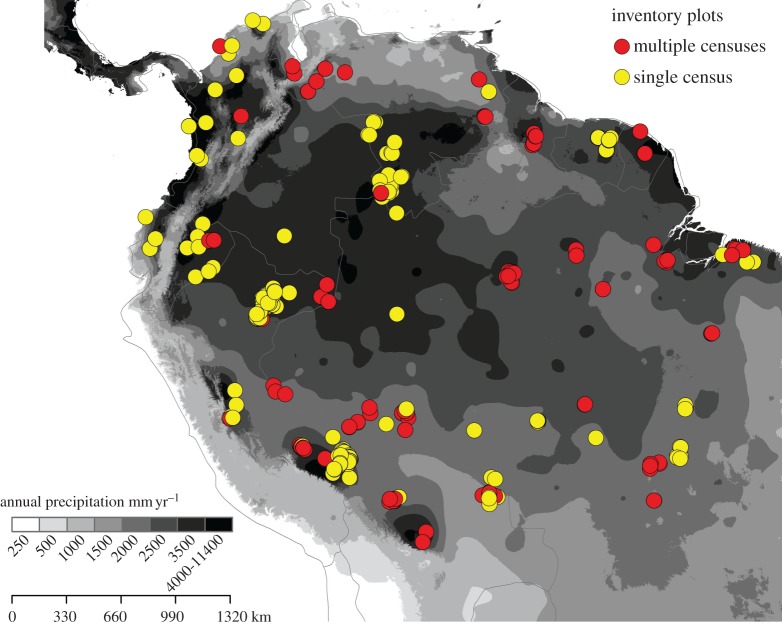
Figure 1.
Map of location of 577 selected plots in lowland tropical South America over a backcloth of the precipitation gradient (annual precipitation, from the WorldClim dataset [28]). The map shows plots, with annual precipitation greater than 1300 mm yr−1 and altitude less than 500 m. Yellow circles: single census, plots used exclusively for estimating wood density and potential tree size; red circles: multi censuses, plots used for estimating wood density, potential tree size, growth and mortality rates.

