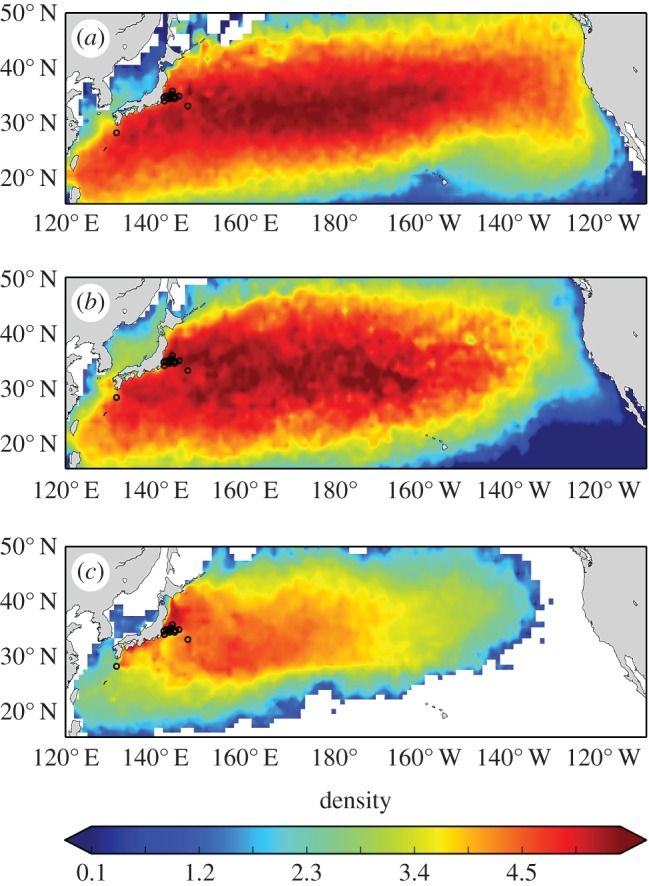
Figure 2.

Predicted distributions assuming passive drift of (a) undrogued surface drifters, (b) drifters with drogues centred at 15 m, and (c) virtual particles released in the surface layer of HYCOM. Computations were made from the 44 start locations (black circles) and integrated through time for the corresponding track durations reported in Supplemental table 1 of Briscoe et al. [13]. Colours in each plot are log10-scaled relative to the HYCOM simulations, assuming a release of 1 000 virtual particles per release site, summed daily throughout the simulation. Panels (a,b) represent predictions taking into account 36 years of in situ oceanic conditions, whereas panel (c) depicts modelled conditions that occurred during the tracking experiment by Briscoe et al. [13].
