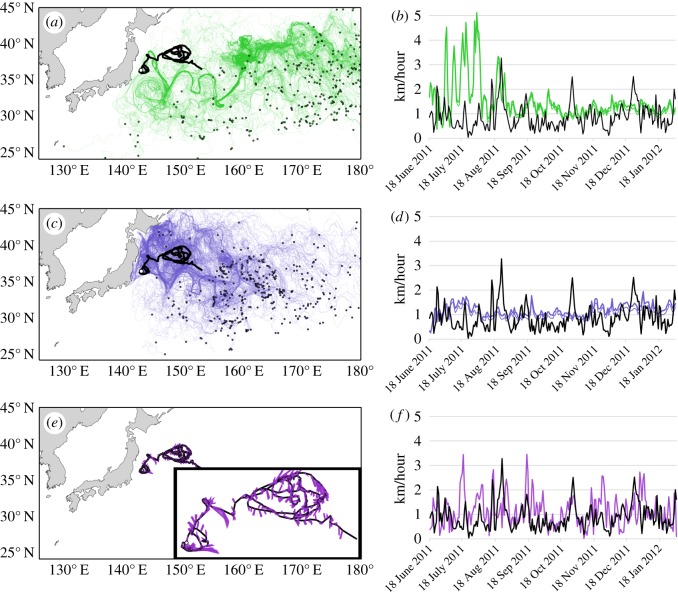
Figure 3.
Tracks of virtual particles released within the surface layer of Global HYCOM relative to the tracks of a surface drifting buoy. (a) The thick black line shows the 230 days track of a drogued drifter ID 35 228 (start location indicated by the white circle). Green lines show the tracks of 500 virtual particles released 0.5° to the south of the drifter's start location (similar to Briscoe et al. [13]) and tracked for 230 days. Small dots indicate the final locations of virtual particles. (b) Graph showing daily drifter speed (black line) and the mean (±95% CI) speed of the 500 virtual particles at daily intervals in kilometres per hour. (c) Same as in (a), but showing tracks of 500 virtual particles released at the start location of the drifter (pale blue). (d) Same as in (b), but blue lines indicate the daily mean (±95% CI) speed of the 500 virtual particles released coincident with the drifter's start location. (e) Purple lines show the 1 day tracks of 200 virtual particles released on the daily positions of the drifter track. The inset surrounded by thick black lines shows a magnified view of the virtual particle trajectories relative to the drifter track. (f) Same as in (b,d), but showing the daily speed of the particle nearest to the subsequent location of the drifter (purple line) along the duration of the drifter track.

