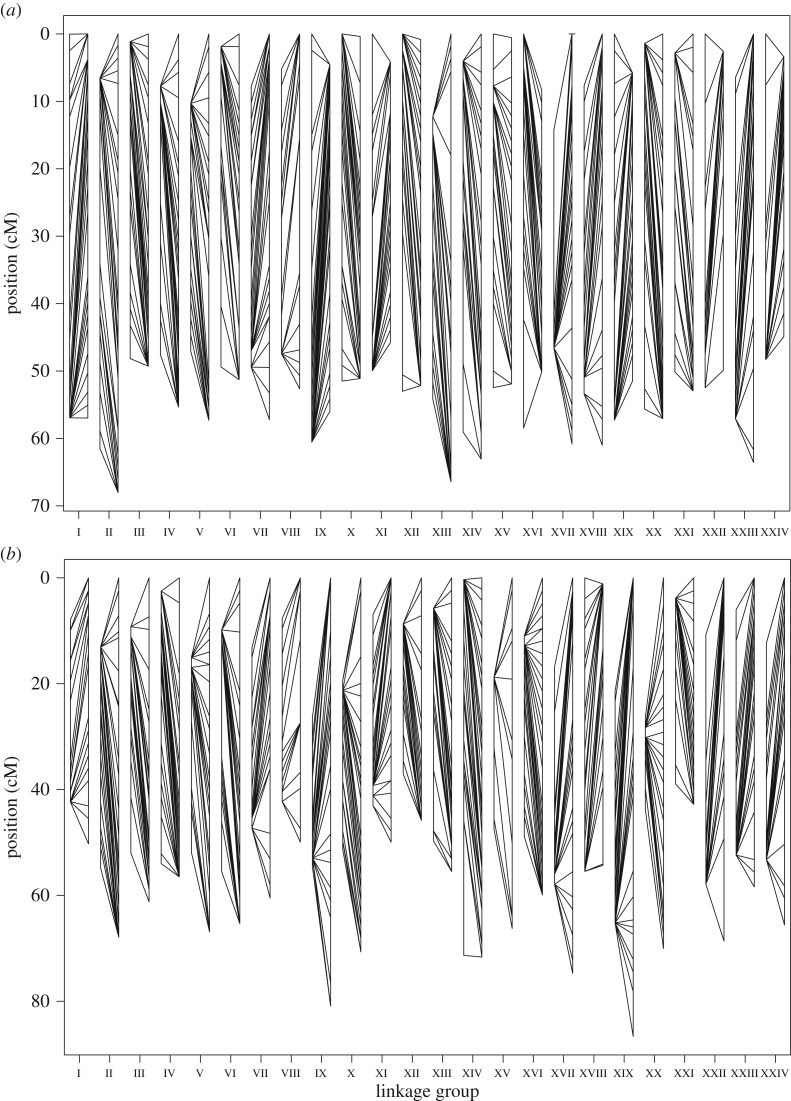
Figure 2.
Comparison between sperm (left) and egg (right) linkage maps for parent 1 (a) and parent 2 (b). The eggs and sperm maps are anchored at the LG midpoint with each line connecting the same marker in the two maps. Differences in recombination between the sexes are particularly pronounced at the LG peripheries (white triangles).

