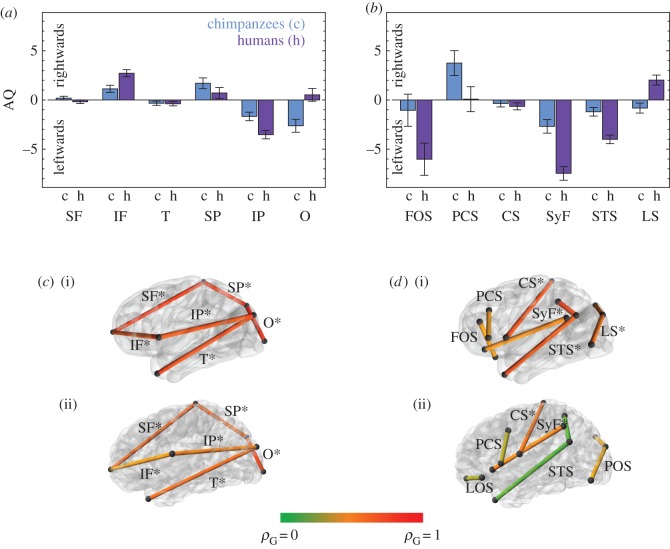
Figure 1.
Analysis of asymmetry based on interlandmark linear distances. (a) Asymmetry quotients (AQs) for lobe proportions (mean AQs and standard errors). (b) AQs for sulcal lengths. (c) Genetic correlations between left and right lobe proportions in chimpanzees (i) and humans (ii). (d) Genetic correlations between left and right sulcal lengths in chimpanzees (i) and humans (ii). Asterisks mark significant genetic correlations in (c) and (d). No AQ shows significant heritability in (a) and (b). Numerical values for heritabilities and colour-coded genetic correlations are provided in the electronic supplementary material, tables S5, S8–S10. SF, superior frontal length; IF, inferior frontal length; T, temporal length; SP, superior parietal length; IP, inferior parietal length; O, occipital length; FOS, fronto-orbital sulcus (latero-orbital sulcus—LOS—in humans); PCS, precentral sulcus; CS, central sulcus; SyF, Sylvian fissure; STS, superior temporal sulcus; LS, lunate sulcus (parieto-occipital sulcus—POS—in humans); ρG, genetic correlation.

