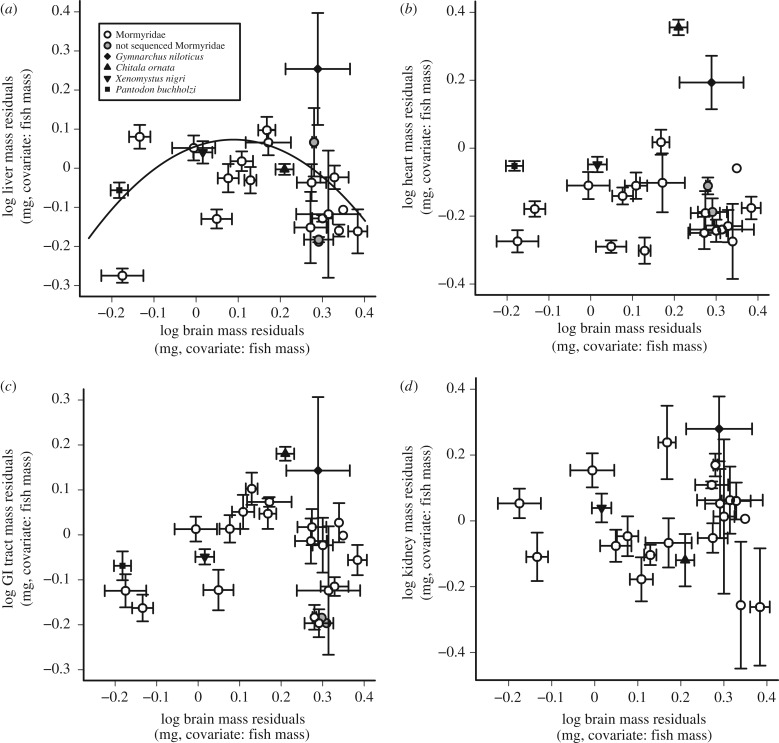
Figure 2.
Relative brain size does not correlate linearly with the relative sizes of other organs. (a–d) Plots of the lineage-averaged residuals from each log organ mass versus log body mass against the lineage-averaged residuals from log brain mass versus log body mass. All residuals are taken from a Brownian PGLS of organ mass versus body mass (electronic supplementary material, table S1). Grey circles are mormyrid lineages that do not have sequence data and are not included in the PGLS regression. There is a significant OU PGLS quadratic relationship between lineage-averaged liver and brain residuals (a, black line).

