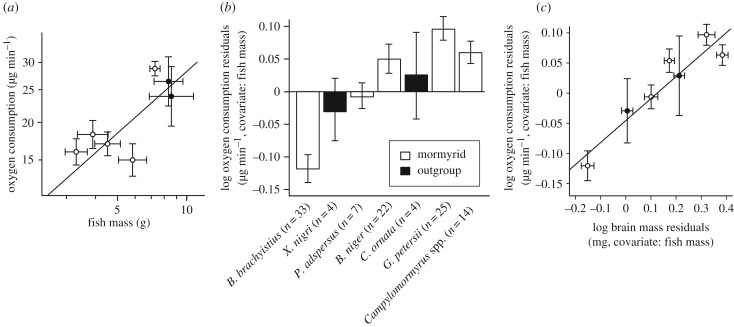
Figure 3.
Relative brain size correlates positively with relative oxygen consumption. (a) Lineage-averaged oxygen consumption against lineage-averaged fish mass shows a negative allometric relationship using Brownian PGLS. Mormyrid genera are shown in white, outgroup genera in black. A plot of log oxygen consumption versus log body mass for all individual specimens across lineages reveals a more continuous distribution than the means and standard errors between lineages suggest (electronic supplementary material, figure S1). (b) Residuals from the Brownian PGLS log oxygen consumption versus log body mass regression show the mean ± s.e.m. of relative oxygen consumption within genera. Lineages are arranged left to right from small to large relative brain mass. (c) Lineage-averaged residuals from log oxygen consumption versus log body mass against lineage-averaged residuals from log brain mass versus log body mass (error bars = s.e.m.) show a positive correlation using OU PGLS. Oxygen consumption and brain residuals are from Brownian PGLS analysis (electronic supplementary material, table S1).

