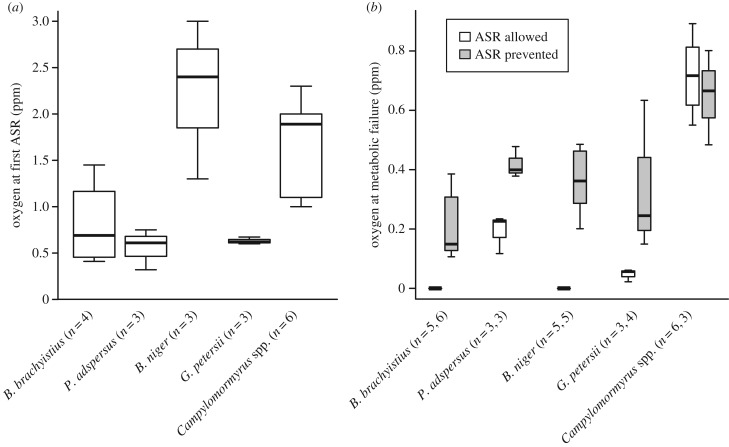
Figure 4.
Small-brained lineages are more hypoxia tolerant than large-brained lineages. Lineages are arranged left to right from small to large relative brain mass. (a) Box plot of the oxygen concentration at which fish first came to the surface for ASR. (b) Box plot of oxygen concentration at which fish experienced metabolic failure. White bars indicate the hypoxia experiment in which ASR was allowed, and grey bars indicate the experiment in which ASR was prevented. Sample sizes are different between panels (a) and (b) due to the camera malfunctioning during one video for B. brachyistius, and the high activity level for two B. niger made it unclear when ASR started.

