
Figure 3.
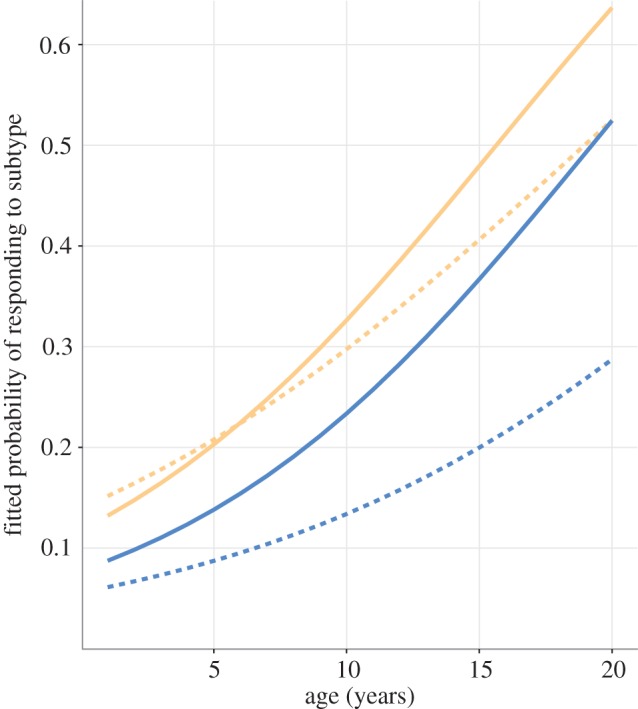
Fitted probability of effect of age and sex (females; pale orange, males; dark blue) on response to H9N9 (solid line) and H9N2 (dashed line) as determined by GLM with logit link. Sample year was included in the model, but does not significantly affect the probability of having a response, so for simplicity, data are shown for 2007. (Online version in colour.)