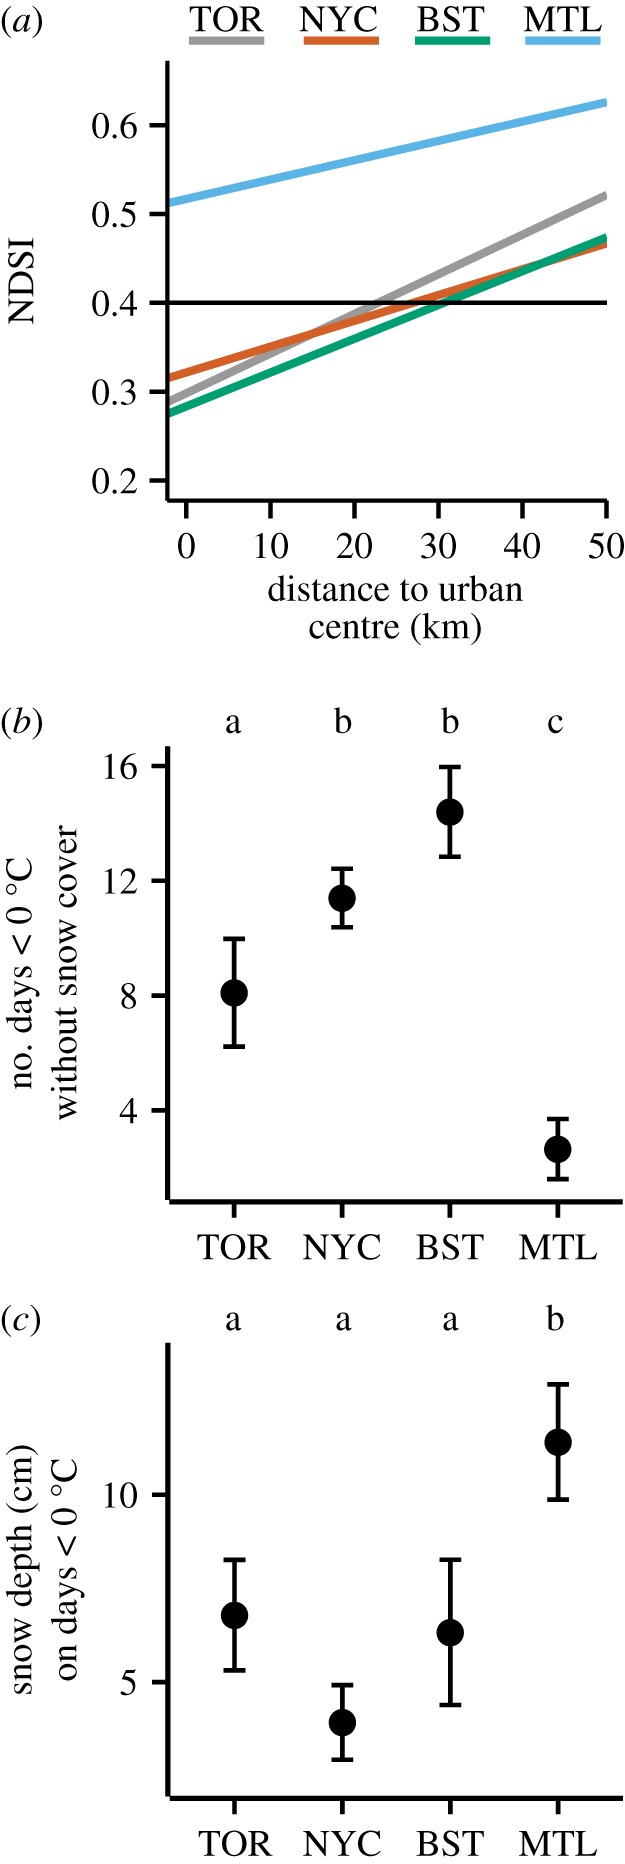
Figure 4.

Historical patterns in January–February snow cover and temperature across the four cities sampled in this study. (a) The NDSI decreased toward the urban centre of each city. The horizontal line at NDSI = 0.4 represents the threshold value for the presence of snow [35]. Montreal (top line) has high snow cover along the entire transect. (b) Montreal (MTL) has fewer days when temperatures are below 0°C and there is no snow cover (±1 s.e.), and (c) deeper snow cover (±1 s.e.) on days where temperatures are less than 0°C, than Toronto (TOR), New York City (NYC) and Boston (BST). Different letters represent significant differences at p < 0.05 (Tukey HSD). (Online version in colour.)
