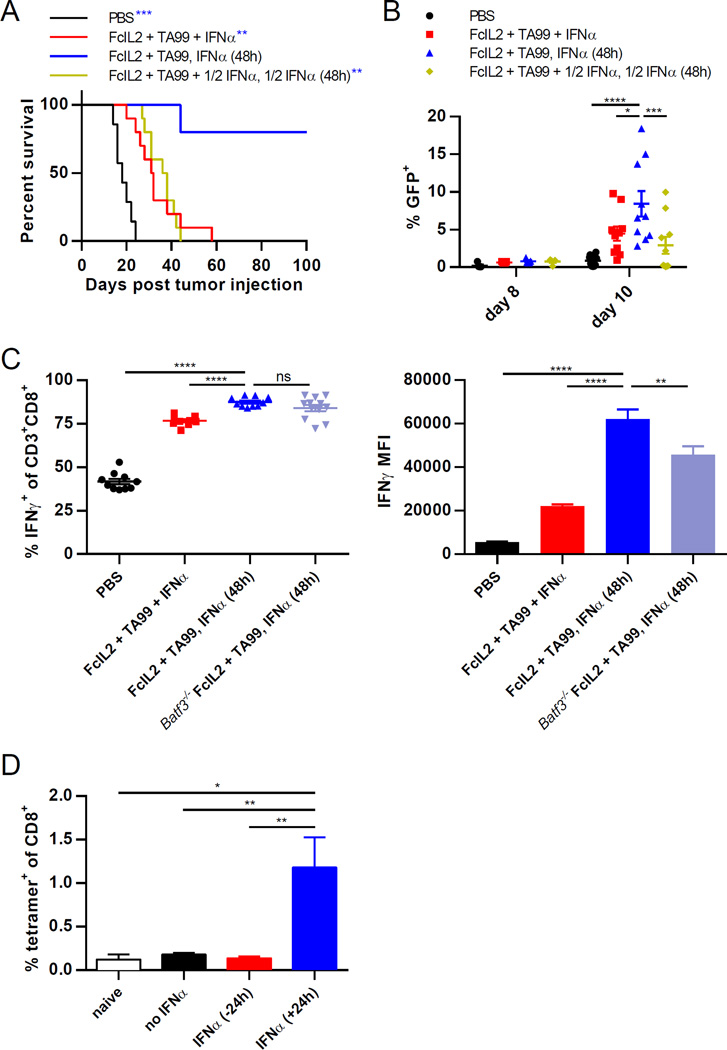
Figure 2. Properly Timed CD8α+ DC Activation Is Necessary for Optimal CD8+ T Cell Priming in Combination Immunotherapy.
(A) Survival curves for mice injected s.c. with 106 B16F10 melanoma cells, then treated on days 6 and 12 with PBS or FcIL2 + TA99. Mice given FcIL2 + TA99 also received IFNα as indicated. n = 5–10 per group.
(B) Percentages of GFP+ draining lymph node CD8α+ DCs from mice treated as described in (A), except that B16F10-GFP instead of B16F10 cells were used. n = 5–10 per group.
(C) IFNγ expression by peripheral blood CD8+ T cells as represented by percentages of IFNγ+ cells or IFNγ MFI levels. On day 12, blood was collected from immunotherapy-treated wild-type or Batf3−/− mice bearing established s.c. B16F10 tumors and incubated for 6 h in the presence of brefeldin A and monensin with PMA/ionomycin restimulation prior to flow cytometric analysis. Background IFNγ expression levels detected using controls incubated without PMA/ionomycin were subtracted from the corresponding samples. n = 10–12 per group.
(D) Percentages of peripheral blood CD8+ T cells staining positive for H-2Kb/SIINFEKL tetramer. Mice were immunized s.c. with OVA and treated with IFNα either 24 h before or after immunization. 7 days later, blood was collected for analysis by flow cytometry. n = 10 per group.
Data represent mean ± SEM. ns, not significant; *p < 0.05; **p < 0.01; ***p < 0.001; ****p < 0.0001 between the indicated pairs or versus the corresponding color group in the legend. See also Figure S3.

